


Oil Prices Vs. Production: See the "Elephant" Almost Everyone Ignores
Commodities / Crude Oil Mar 29, 2018 - 10:10 AM GMTBy: EWI

If production drives prices, how does oil rise 14x when production trends sideways for 10 years?
There's a widespread assumption that supply and demand drive oil prices. Almost all economists base their oil forecasts entirely on this premise, and so do many speculators.
If the oil industry ramps up production and increases supply, economists expect a drop in oil prices. If production decreases, or some other factors hint at supply constraints, they anticipate a rise in oil's price.
A case in point is this March 23 CNBC headline:
Trump security pick John Bolton likely to turn up heat on Iran and boost oil prices
As you may know, Bolton is considered to be "hawkish" toward Iran, so the thinking goes that a ramping up of U.S. sanctions against the nation could hamper Iranian oil production or Iran's ability to sell oil on the open market.
It may very well turn out that oil prices do move higher, but, according to our research, production is not everything.
Consider this graph and commentary from EWI founder Robert Prechter's 2017 book, The Socionomic Theory of Finance:
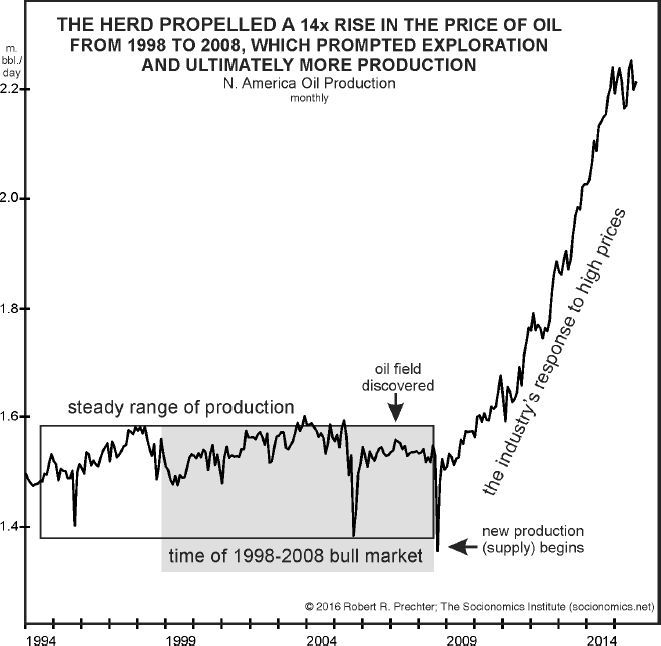
Supply-demand theorists glance at this graph and declare that the trend toward more U.S. oil production caused oil's price to fall. But the claim does not bear scrutiny. How does one get a 14-times rise in the price of oil out of the perfectly sideways production trend from 1998 to 2008? It seems a bit extreme. Oil prices then crashed before the volume of production emerged from its historical range, an event that doesn't fit the mechanics paradigm. Finally, it is outright impossible to account for the fact that oil prices tripled as production surged from December 2008 to May 2011 and held up for three years thereafter as production continued to expand. This history of behavior mercilessly mocks the ubiquitous assumption that changes in the supply of oil determine changes in its price. Yet no one seems to notice.
Rather than a change in supply dictating a change in price, the chart shows one thing unequivocally: that a change in price ultimately encouraged the discovery of a new source of supply. The huge, 14-times rise in the price of oil from 1998 to 2008 prompted U.S. oil producers to step up exploration, which ultimately led to new production.
So, if you're an oil trader, basing your trading decisions on the traditional supply-demand model may do great damage to your portfolio. Supply and demand factors do play a role in price formation, but they are far from being the only factors.
The trend in collective psychology of speculators, reflected by Elliott wave price patterns on oil's price chart, govern oil prices to a much higher degree.
Indeed, the fact is that the Elliott wave model helped EWI call "every major turn in crude oil since 1993." It's a verifiable claim.
Now is the time to learn more about this essential forecasting tool, so you can stay ahead of the oil market trend -- as well as those in other major financial markets.
Even the Surprise Disruption in Oil Supply by Hurricane Katrina Failed to Make Crude Prices Soar!
Plus, how does an oil market observer explain "why the price of oil zoomed 1,300% in ten years, crashed over 78% in five months, tripled in 2 1/2 years and then plunged 75%"
EWI's research reveals that a major shift in supply and / or demand did not either precede or happen at the same time as any of these big changes in oil prices.
So, what does govern the trend of oil prices?
In this compelling video from EWI founder Robert Prechter, you'll learn how a team of oil market analysts anticipated every major price move since 1993 -- including crude's 75% crash in 2014-2015.
Watch Now: The Forecasting Tool That Called Every Major Turn in Crude Oil Since 1993.
This article was syndicated by Elliott Wave International and was originally published under the headline Oil Prices Vs. Production: See the "Elephant" Almost Everyone Ignores. EWI is the world's largest market forecasting firm. Its staff of full-time analysts led by Chartered Market Technician Robert Prechter provides 24-hour-a-day market analysis to institutional and private investors around the world.
© 2005-2022 http://www.MarketOracle.co.uk - The Market Oracle is a FREE Daily Financial Markets Analysis & Forecasting online publication.