Stock Market Analysis: Baying for Blood
Stock-Markets / Financial Markets 2018 Feb 07, 2018 - 06:31 AM GMTBy: Abalgorithm
 The wall street bear has woken up. The Dow Jones Industrial Average posted its largest-ever, single-day point decline and major indexes in the U.S., Europe and Asia gave up their gains for the year.The Dow briefly dropped nearly 1,600 points. Although it quickly pared losses, the blue-chip index closed down 1,175.21 points, or 4.6%, to 24345.75, its largest one-day percentage decline since August 2011.
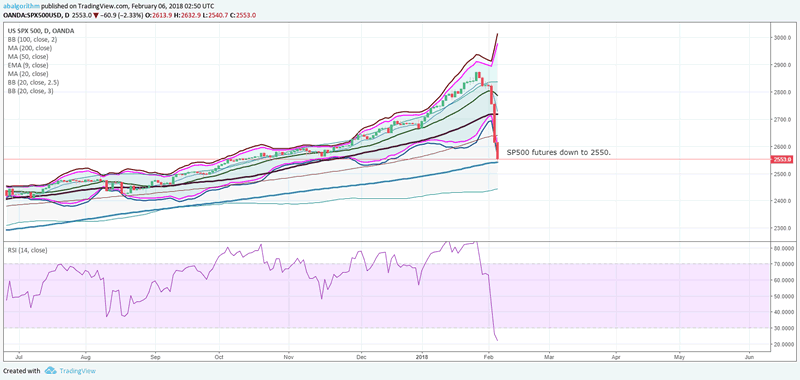
At the time of writing the futures were further down to 2550 from the close of 2639. That is an important level of support. However we expect it to be tested.
SP500 Futures
SPX Index
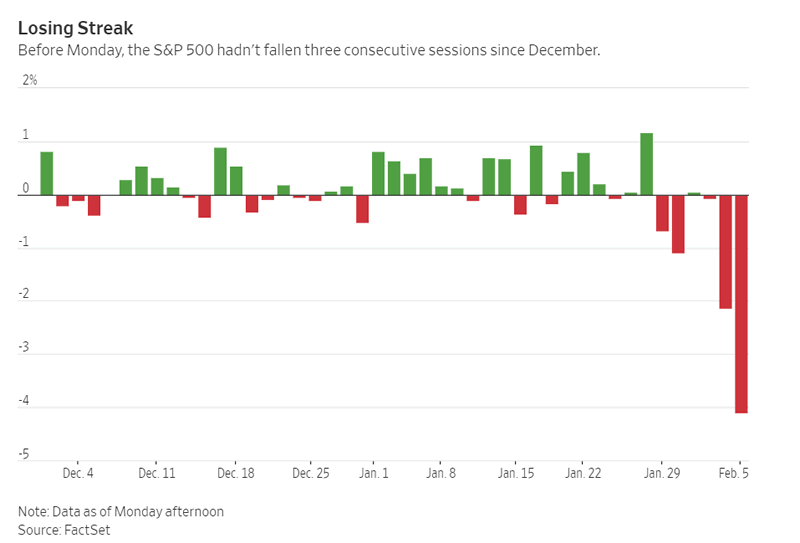
Monday’s selling was broad-based, with all 11 sectors in the S&P 500 posting declines. Bank shares slid, sending the KBW Nasdaq Bank Index of large U.S. lenders down 4.9% and extending declines after posting its steepest loss of the year Friday. Declines in shares of oil-and-gas companies also dragged on major indexes. The S&P 500 energy sector shed 4.4%, while U.S. crude oil declined 2% to $64.15 a barrel. The fall was further painful for retail investors because enthusiasm for stocks led investors to pour a record $102 billion in January into mutual funds and exchange-traded funds that invest in equities globally. But cracks emerged last week when government bond yields jumped to four-year highs, raising fears among some investors of a faster-than-expected pickup in inflation. The selling that resulted was broad, sending everything from shares of energy companies to banks to technology giants lower.
Meanwhile, a measure of expected swings in the S&P 500, the Cboe Volatility Index, shot higher, jumping 117%—its largest one-day percentage gain ever.

VIX has hit a new high for the year at 37 after averaging under 12 for over 4 years. We had reported in our previous post about VIX headed higher. It had painted a floor and there was only one way for it go. UP!
We are abalgorithm has been alerting clients to the possibility of a severe correction. The data coming out of US has been weak as opposed to strong. Many main stream news outlets have been reporting data to be deceptively strong however the F-indicator at abalgorithm that tracks 100s of economic data points had shown significant weakness. Stock markets had diverged from the economy for over 3 months but stocks generally tend to the fundamentals with some delay.
Given the sharp fall in equities, we see strong correction back higher even possibly to 2700. But that may take a few weeks to materialize.
AAPL : Bull market bell weather

AAPL has broken below the 200 DMA. The uptrend of the last one year is over. However expect a reaction higher from broken trend line to challenge the previous highs.
Treasury Yield: Flight to safety
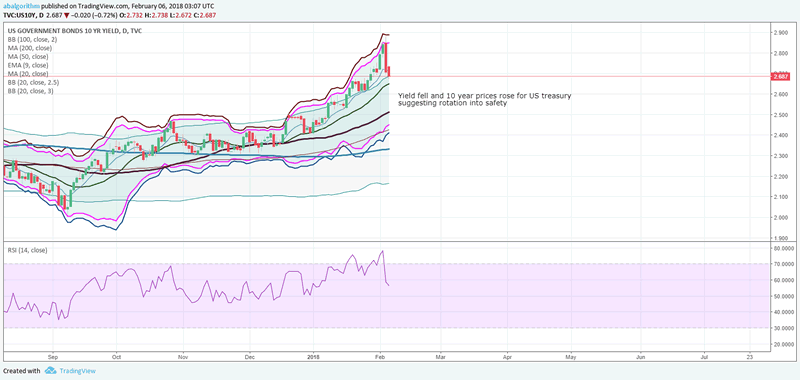
US10Y yield broke below 2.7 %. Money is flowing to safety out of risky assets. There is a flight to safety and hence we as trader need to align ourselves to the new normal.
F Indicator
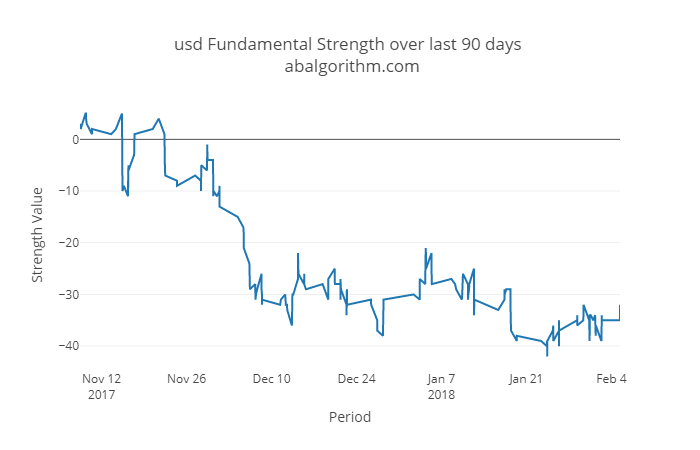
US economy has been consistently trending down in terms of fundamental data releases. However stock market has been diverging from fundamentals and rose to record highs. Ultimately we believe fundamentals will impose itself.
GOLD

USDJPY downtrend intact
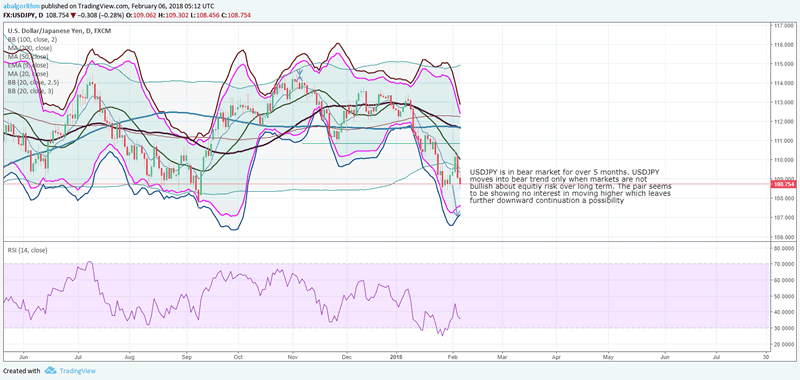
USDJPY is in bear market for over 5 months. USDJPY moves into bear trend only when markets are not bullish about equity risk over long term. The pair seems to be showing no interest in moving higher which leaves further downward continuation a possibility.Short on a break of 108 to 106.
BITCOIN
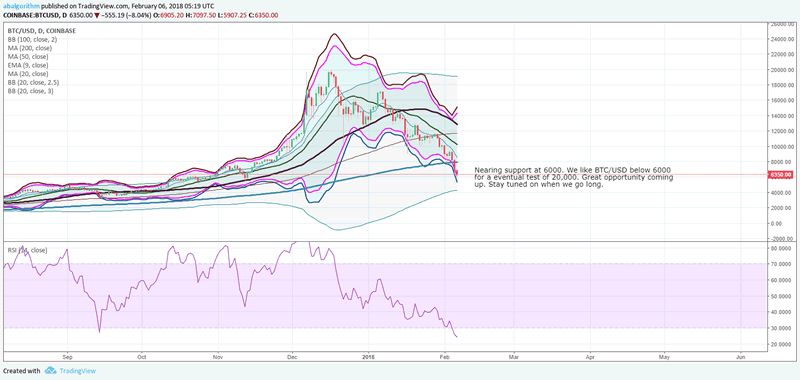
Bitcoin has corrected as expected. The correction has been severe as we noted in our previous analysis . Then prices were at 8300$. We were waiting for longs below $6000. We have reached near $6000 and we will be watching for lower time frame to see if bottoming happens. The fall in Bitcoin was in regard to regulation around the world however BITCOIN has become a tradeable asset as CBOE launches bitcoin futures. Therefore it will be just as regulated as any traded asset. So expect BITCOIN to form floors at important support 6000 before going long.
STOCK MARKET INTERNALS
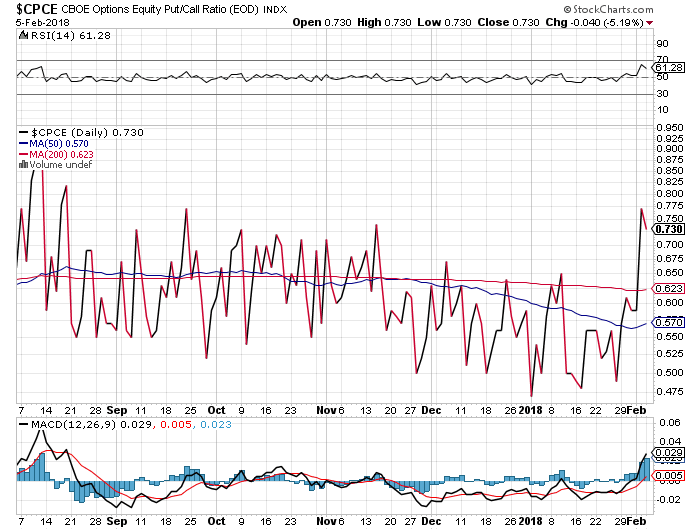
The putcall ratio has risen to new yearly highs.
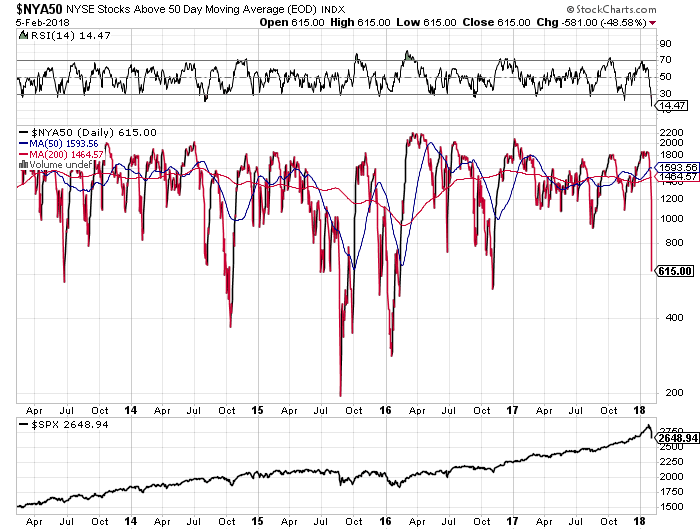
The number of stocks trading above 50 DMA has fallen to 690 stocks. The number was well over 1000 last week.
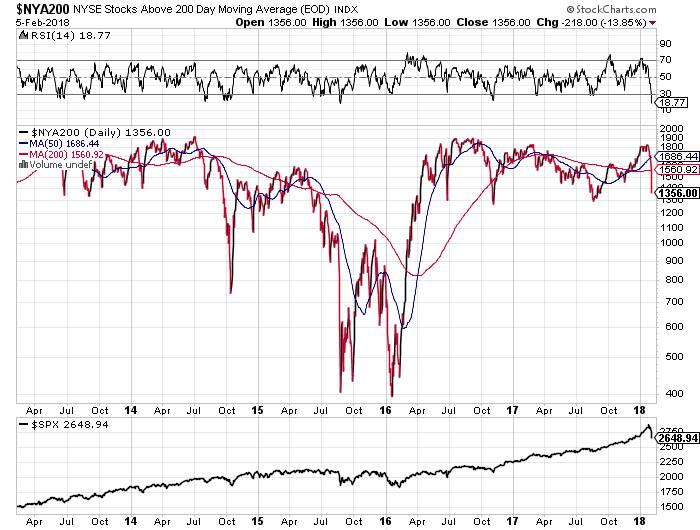
The number of stocks trading over long term uptrend lines of 200 DMA has fallen to 1300 from 1900 last week.
As observed the market internals have deteriorated significantly while the fundamental economy has finally started to impose on the stock markets. The market correction is simply a reflection of reality and correction of an overpriced market. The flight to safety with treasury prices rising and yields on 10 Year falling along with movement of capital to utility ETF suggests that smart capital does not expect long term bull market revive in the first 6 months of 2018. However we do expect some strong bounce in equity markets into MARCH which will be bounce of supports
About abalgorithm
abalgorithm.com operates an automated forex trading system which copies trades to its clients around the world. Our clients are able to reap the benefits of a class superior trading system along with industry leading research. We also host the F Indicator which is a fundamental indicator tracking all major economies.
Here is the latest equity snapshot of the trade copier service
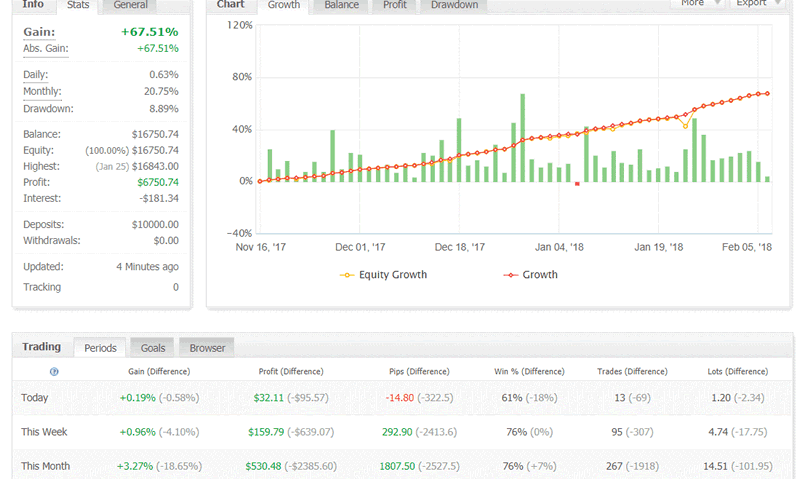
The system has made +67.5% return since November launch averaging over +20% a month. It trades over 30 pairs including exotics like USDSEK. Trading system uses advanced concepts lie hedging and machine learning. All you need is a MT4 terminal and decent capital to trade. You can apply here: Contact US
About Us
abalgorithm.com is a quant based research and trading firm. We operate a high performance FX trade copier service which uses Machine Learning as its core. You can check the results here: TRADE COPIER 3 MONTHS REPORT: +53%
More performance reports
In addition, we operate a LIVE TRADE ROOM along with daily indepth research and manual trade calls. Clients and guests can have a lively discussion of the state of the world economy and trading opportunities.
To join our trade copier: Fill the form
About Abalgorithm.com
Abalgorithm operates an automated quant forex trade copier and a live trade room for clients who trade forex. We also provide daily research on equities, bonds, ETF, commodities. We are located at http://abalgorithm.com
© 2018 Copyright Abalgorithm - All Rights Reserved Disclaimer: The above is a matter of opinion provided for general information purposes only and is not intended as investment advice. Information and analysis above are derived from sources and utilising methods believed to be reliable, but we cannot accept responsibility for any losses you may incur as a result of this analysis. Individuals should consult with their personal financial advisors.
© 2005-2022 http://www.MarketOracle.co.uk - The Market Oracle is a FREE Daily Financial Markets Analysis & Forecasting online publication.


