


Stock Market Trendlines are Violated. SPX Sell is On
Stock-Markets / Stock Markets 2018 Jan 30, 2018 - 03:07 PM GMT

 Good Morning!
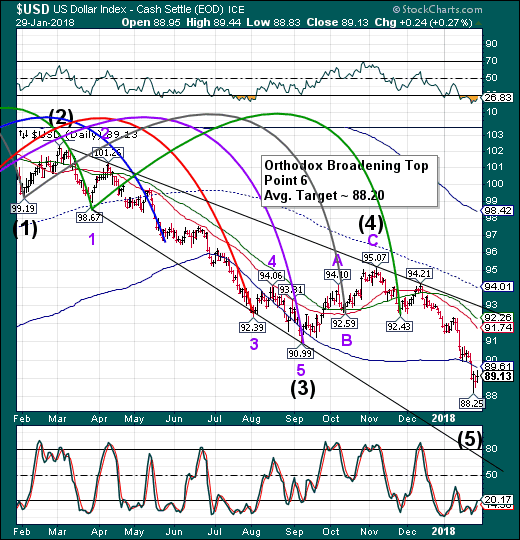
USD futures are sown this morning as the index probes toward a new low. Yesterday it back-tested its Cycle Bottom resistance prior to the resumption of its decline. As mentioned, USD is likely to overshoot its target before the main reversal. The Cycles Model implies that the turn may come on Monday February 5. If so, I suggest taking downside profits on Friday.
ZeroHedge reports, “The global selloff that started on Monday as traders were spooked by the double whammy of surging interest rates and fears about iPhone X demand, and resulting in the biggest drop in US stocks since September, accelerated overnight and as seen below world stocks and US equity futures are a sea of red this morning:”
SPX futures have broken their Ending Diagonal trendline at 2850.00 in overnight trading. This is a trendline sell signal that is aggressive in nature, suggesting the “buy the dip” impulse may still be alive, but the odds are now favoring the decline.
However, once the lower trendline of the Broadening Wedge at 2735.00 is broken, the decline is reinforced. This implies that Wave 2 may be insignificant to the decline unless it happens above that trendline.
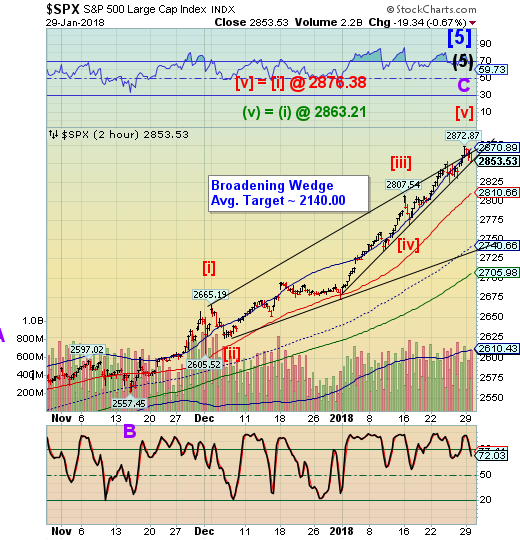
The Cycles Model suggests minor bounces on or near February 9, March 2 and an ultimate low on or near March 23. That’s right. The decline may last nearly two months.
Bloomberg reports, “European equities followed Asian peers lower and U.S. stock futures retreated as caution crept into the market after one of the best starts to a year in recent history. The selloff in Treasuries paused and the dollar weakened, while oil dropped for a second session.”
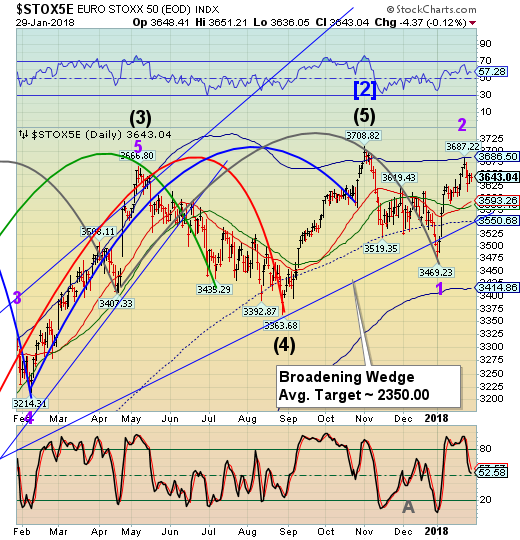
In case you didn’t catch it, this may be a world-wide selloff. The coming Wave 3 decline in STOXX may be finished only a few days before the US equities market reaches its bottom.
VIX futures are approaching the massive Ending Diagonal trendline just above 14.00. This is where the proverbial wheels fall off, so it may be wise to own one of the VIX ETFs. Yesterday I highlighted VXX, which closed just beneath its Ending Diagonal trendline at 30.00. It is likely that it may open above that resistance.
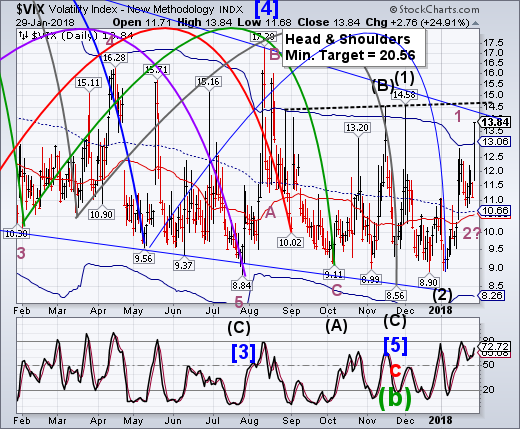
The significance is that the trendline stretches back to the February 12, 2016 high and possibly further. Once trendlines are crossed, they may be expected to be completely retraced.
I have an appointment with my cardiologist this morning, so I will report back on the Hi-Lo Index after I return. Yesterday it closed at 194.00, which is a significant level above the mid-Cycle support at 113.09.
The data feed that is used by StockCharts is apparently not working this morning. However, the futures data feed to Investing.com is.
TNX futures are at a new high this morning, at 27.33. The Cycles Model suggest that TNX may stay strong until February 9. This is in conflict with UST, which is due for a Master Cycle low. However, February 9 is 17.2 days from the average Master Cycle pivot calendar, which is 258 days, on average. One of my studies shows that 92% of all Master Cycles occur within 4 days of the average, but it is not unusual to see the stretch to 17.2 days.
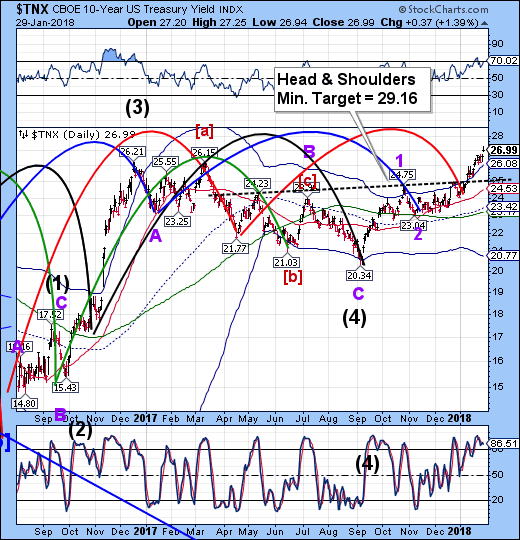
In this case, the TNX Cycle is on time, while the UST Cycle may be off. In addition, it appears that the Head & Shoulders formation is valid and has more to go.
Crude oil is lower this morning, but hasn’t crossed the upper Ending Diagonal trendline. There is no signal until that happens.
Regards,
Tony
Our Investment Advisor Registration is on the Web.
We are in the process of updating our website at www.thepracticalinvestor.com to have more information on our services. Log on and click on Advisor Registration to get more details.
If you are a client or wish to become one, please make an appointment to discuss our investment strategies by calling Connie or Tony at (517) 699-1554, ext 10 or 11. Or e-mail us at tpi@thepracticalinve4stor.com .
Anthony M. Cherniawski, President and CIO http://www.thepracticalinvestor.com
As a State Registered Investment Advisor, The Practical Investor (TPI) manages private client investment portfolios using a proprietary investment strategy created by Chief Investment Officer Tony Cherniawski. Throughout 2000-01, when many investors felt the pain of double digit market losses, TPI successfully navigated the choppy investment waters, creating a profit for our private investment clients. With a focus on preserving assets and capitalizing on opportunities, TPI clients benefited greatly from the TPI strategies, allowing them to stay on track with their life goals.
Disclaimer: The content in this article is written for educational and informational purposes only. There is no offer or recommendation to buy or sell any security and no information contained here should be interpreted or construed as investment advice. Do you own due diligence as the information in this article is the opinion of Anthony M. Cherniawski and subject to change without notice.
Anthony M. Cherniawski Archive |
© 2005-2022 http://www.MarketOracle.co.uk - The Market Oracle is a FREE Daily Financial Markets Analysis & Forecasting online publication.