


More New Record Highs, But Stocks Bull Market May Die On That Euphoria
Stock-Markets / Stock Markets 2018 Jan 29, 2018 - 02:16 PM GMTBy: Paul_Rejczak

 The U.S. stock market indexes gained between 0.9% and 1.3% on Friday, extending their uptrend despite worse-than-expected advance GDP number release, as investors' sentiment remained very bullish.
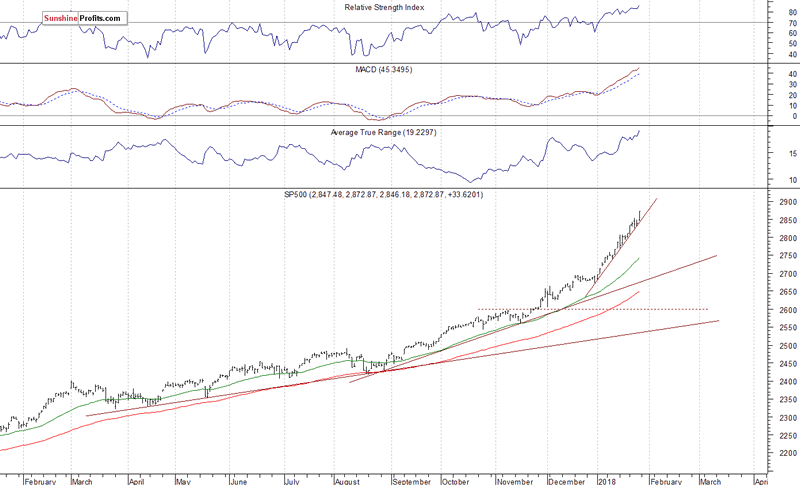
The S&P 500 index has reached new record high at the level of 2,872.87. It broke above its Wednesday's high of 2,852.97. The Dow Jones Industrial Average has also reached new record high at the level of 26,616.71. It was relatively weaker than the broad stock market, as it gained 0.9%. The technology Nasdaq Composite reached new record high of 7,505.77, as it gained 1.3% on Friday.
The nearest important level of support of the S&P 500 index is now at around 2,850-2,855, marked by Wednesday's local high. The next support level is at 2,825-2,830, marked by some previous local lows. The support level is also at 2,800-2,810. The support level is the price level, at which the buying interest is strong enough to overcome selling pressure and push the price higher. Support usually refers to the previous low or lows, lines that are created by drawing the line between previous important bottoms or important tops and then extrapolating this line into the future. We still can see medium-term technical overbought conditions, but the market extends its nine-year-long bull market:
Reversal Off New Record High
Expectations before the opening of today's trading session are slightly negative, because index futures trade 0.1-0.2% lower vs. their Friday's closing prices. The European stock market indexes have been mixed so far. Investors will wait for Personal Income, Personal Spending numbers release at 8:30 a.m. The market expects that Personal Income grew 0.3%, and Personal Spending grew 0.5% in December.
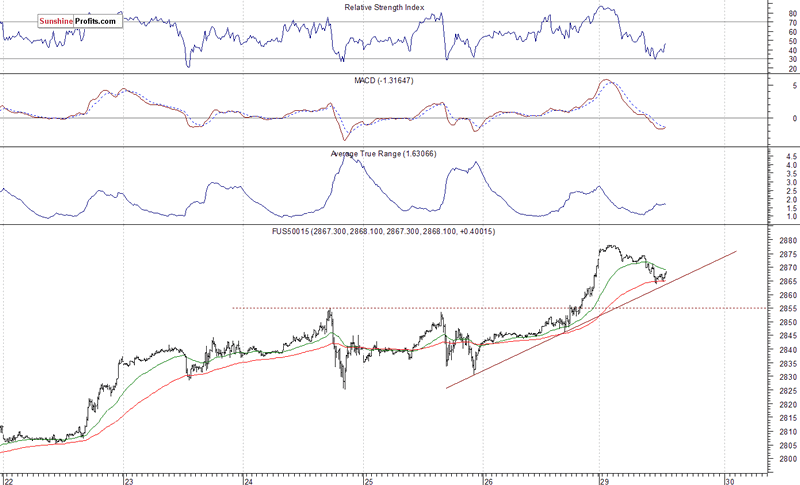
The S&P 500 futures contract trades within an intraday downtrend, as it retraces its overnight advance. The market reached new record high closer to 2,880 mark. But will it continue higher today? For now, it looks like some short-term bearish reversal pattern off that new record high. The nearest important resistance level is at around 2,875-2,880. The market will probably remain below its overnight high today. On the other hand, the nearest important support level is at 2,850-2,860, marked by some recent local highs. The next level of support is at 2,835-2,840, marked by short-term consolidation. The futures contract trades above its short-term upward trend line, as we can see on the 15-minute chart:
Nasdaq Also Lower
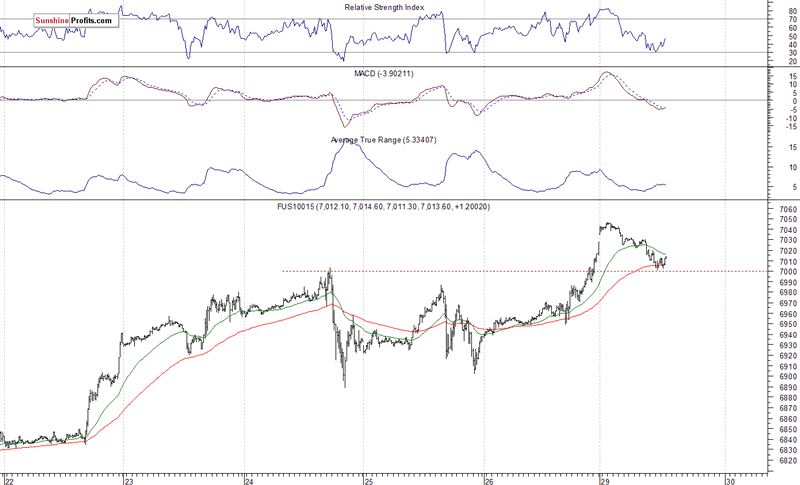
The technology Nasdaq 100 futures contract follows a similar path, as it retraces its overnight rally this morning. But will the uptrend continue? Potential resistance level is at around 7,040-7,050, marked by new record high. On the other hand, support level is at 7,00, marked by previous level of resistance. The next support level is at 6,950, among others. The Nasdaq 100 futures contract remains just above its short-term support level of 7,000, as the 15-minute chart shows:
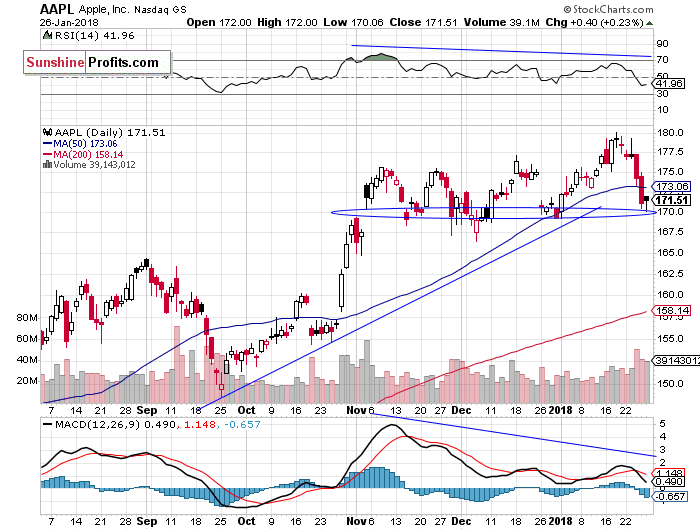
Let's take a look at Apple, Inc. stock (AAPL) daily chart (chart courtesy of http://stockcharts.com). It remains relatively very weak vs. the broad stock market. It is worth mentioning because Apple's market capitalization is close to $900 billion, which is almost two times more than the value of all the cryptocurrencies combined. The stock reached new record high two weeks ago, following short-term consolidation along the support level of $175. The market got closer to $180 mark, but it failed to continue higher. Consequently, the stock retraced most of this month's advance on Wednesday and Thursday last week. It trades just above support level of $165-170 again. The rally ahead of February 1 quarterly earnings release seems less likely at this moment:
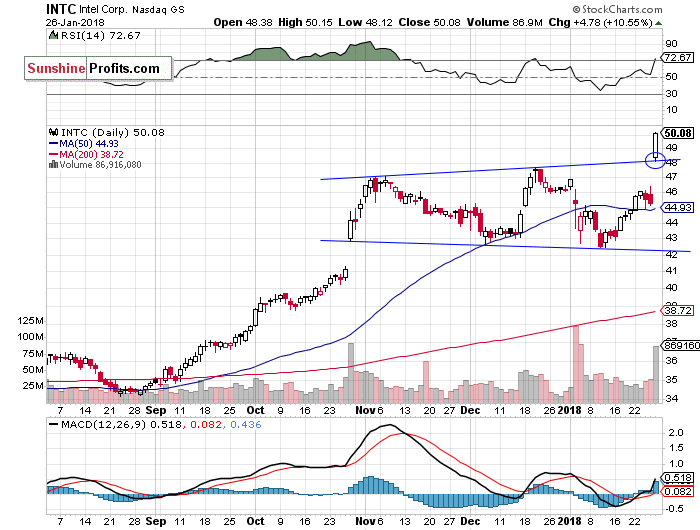
Intel Corp. stock (INTC) released better-than-expected quarterly earnings release on Thursday, and it accelerated its uptrend on Friday. We wrote about that stock and its potential three-month-long expanding triangle pattern in our Friday's Stock Trading Alert. The expanding triangle is a very interesting pattern, because the price is making series of lower lows and higher highs. If the stock will break through upper level, then there is a big chance that it continues higher. And so it did:
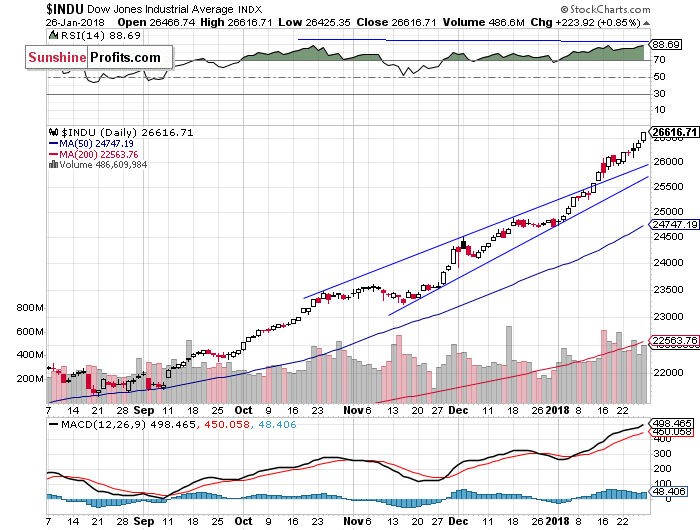
The Dow Jones Industrial Average daily chart shows that blue-chip index reached new record high on Friday, as it further extended its short-term uptrend following breakout above 26,000 mark. We still can see medium-term negative technical divergences. The most common divergences are between asset’s price and some indicator based on it (for instance the index and RSI based on the index). In this case, the divergence occurs when price forms a higher high and the indicator forms a lower high. It shows us that even though price reaches new highs, the fuel for the uptrend starts running low. However, the index trades above its two-month-long rising wedge pattern (failed potential uptrend reversal pattern), which confirms its multi-year bull market:
Concluding, the S&P 500 index gained 1.2% on Friday, as it broke above its three-day-long consolidation. The broad stock market remained within a short-term consolidation, and despite worse-than-expected Advance GDP number release it has managed to reach new record high after gaining over 1%. All major stock market indexes reached new record highs on Friday.
The S&P 500 index is trading around 7.5% above its December 29 yearly closing price. This almost month-long rally seems unprecedented. The legendary investor John Templeton once said that "bull markets are born on pessimism, grow on skepticism, mature on optimism and die on euphoria”. So, is this an euphoria phase of the nine-year-long bull market? It's hard to say, but some major downside risks are growing.
There have been no confirmed negative signals so far, but we still can see medium-term overbought conditions. We can use indicators such as Relative Strength Index (RSI), Stochastic Oscillator, Money Flow Index to identify overbought conditions. For example, one can view a given market as "overbought" if the RSI indicator for this market is above 70. Paying attention to the overbought/oversold status of the market is very useful, but there are many other factors that need to be considered before placing a trade.
If you enjoyed the above analysis and would like to receive free follow-ups, we encourage you to sign up for our daily newsletter – it’s free and if you don’t like it, you can unsubscribe with just 2 clicks. If you sign up today, you’ll also get 7 days of free access to our premium daily Gold & Silver Trading Alerts. Sign up now.
Thank you.
Paul Rejczak
Stock Trading Strategist
Stock Trading Alerts
SunshineProfits.com
Stock market strategist, who has been known for quality of his technical and fundamental analysis since the late nineties. He is interested in forecasting market behavior based on both traditional and innovative methods of technical analysis. Paul has made his name by developing mechanical trading systems. Paul is the author of Sunshine Profits’ premium service for stock traders: Stock Trading Alerts.
* * * * *
Disclaimer
All essays, research and information found above represent analyses and opinions of Paul Rejczak and Sunshine Profits' associates only. As such, it may prove wrong and be a subject to change without notice. Opinions and analyses were based on data available to authors of respective essays at the time of writing. Although the information provided above is based on careful research and sources that are believed to be accurate, Paul Rejczak and his associates do not guarantee the accuracy or thoroughness of the data or information reported. The opinions published above are neither an offer nor a recommendation to purchase or sell any securities. Mr. Rejczak is not a Registered Securities Advisor. By reading Paul Rejczak’s reports you fully agree that he will not be held responsible or liable for any decisions you make regarding any information provided in these reports. Investing, trading and speculation in any financial markets may involve high risk of loss. Paul Rejczak, Sunshine Profits' employees and affiliates as well as members of their families may have a short or long position in any securities, including those mentioned in any of the reports or essays, and may make additional purchases and/or sales of those securities without notice.
Paul Rejczak Archive |
© 2005-2022 http://www.MarketOracle.co.uk - The Market Oracle is a FREE Daily Financial Markets Analysis & Forecasting online publication.