


5 Economic Predictions for 2018
Economics / Financial Markets 2018 Jan 18, 2018 - 02:08 AM GMTBy: John_Mauldin

 Only two weeks in and 2018 is already breaking records—mostly in a good way.
But that leaves 50 potentially less enjoyable weeks to go. So rather than focus on promising current events, I think I’d better dip into my annual forecast bag and share a few highlights from my friends with you. (you can find the previous part of the 2018 forecast here)
These are the people I follow, read, and trust for their financial expertise.
Easterling: A Correction Is Inevitable
We’ll start with Ed Easterling’s invaluable Crestmont Research.
Ed is one of the top experts on market valuations. We looked at some of his work right after the 2016 election (see “The Trump Rally Will Morph”), specifically concerning price/earnings ratios.
P/E is a good timing indicator over very long periods, but stocks can stay overvalued or undervalued for years. The P/E has stayed between 10 and 25 most of the time but can move way above or below that range and stay there awhile.
As of this writing, the S&P 500 trailing P/E ratio is around 22—elevated but not signaling imminent doom. It’s higher by some other metrics.
Here’s a bit from Ed’s year-end update:
P/E is above sustainable levels and beyond the level that is appropriate for a low-inflation environment. Regardless of whether the current environment is designated as a secular bear or secular bull, an elevated P/E means that returns over the next 5–10 years will be below average, and years with excess returns (like 2017) simply pull forward future returns and increase the magnitude of subsequent corrections.
By Ed’s methodology, stocks are still in the bear market that began back in 2000. P/E ratios troughed at a below-average level, as you can see in the lower right of this chart.
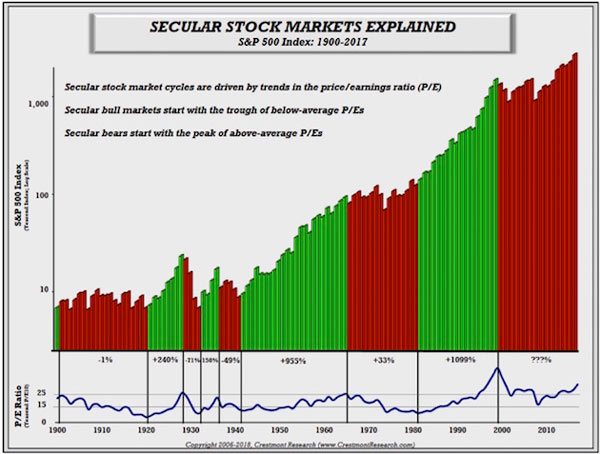
Source: Crestmont Research
The next bull cycle won’t begin until the P/E ratio troughs somewhere below 15. As Ed says, valuations should not be this high while inflation is this low. Yet they are. That disconnect will get resolved at some point but perhaps not imminently.
That means prices have to drop considerably from here. Will it happen this year? I think probably not.
Jensen: The US Is 1980s Japan
Niels Jensen of Absolute Return Partners is a rarity: a risk manager whose writing is informative and entertaining at the same time.
In his latest letter, Niels lists five top predictions for 2018:
1. Turbulent Brexit negotiations taking the UK to the cliff edge.
2. General elections in Italy turning the country anti-EU.
3. Mayhem in Saudi Arabia leading to a dramatic rise in oil prices.
4. Synchronized GDP growth leading to rising wage inflation.
5. The US equity market turning into the Japan of the late 1980s.
He then explains them in more detail, which you can read here. I’ll quote his point on the US turning into Japan because I think it has some similarity to Ed Easterling’s outlook above.
Now to the final one of my five concerns. Japan of the late 1980s – what do I mean by that? As I am only too aware that not all my readers are as old as I am, allow me to summarise what happened in Japan in the late 1980s.
Back then Japan delivered the mother of all bull markets. Equity prices kept going up and so did property prices, with investors paying little attention to economic logic. At the peak, the land surrounding the Imperial Palace in Tokyo was said to be worth more than all of California! The Japanese even have a name for that extraordinary bubble: バブル景気.
The bubble was characterised not only by inflated asset prices but also by a largely uncontrolled money supply, excessive credit expansion, and disproportionate monetary easing. Does that ring a bell? By the early 1990s, it was all over, and the decade of the 90s turned into what is now known as the Lost Decade.
What I don’t like about US equities right now is that they defy logic, just as Japanese equities defied reason back in the late 80s. US valuations are not only out of whack with those of other equity markets around the world but also relative to past valuation levels:
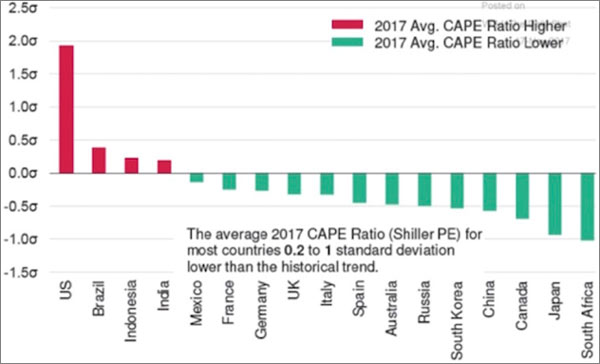
Equity valuations in various countries
Source: Moody’s Investor Service, The Daily Shot
Niels continues:
Furthermore, as a result of inflated equity prices and strong property markets, US wealth is accumulating at a faster pace than anywhere else (exhibit 7). The best way to measure how much asset price inflation has affected wealth in the US is to zoom in on the wealth-to-GDP ratio, which is long-term constant. (Note: I don’t intend to go into any level of details here as to why that is, but it is a major topic in my forthcoming book.) The US mean value is 3.8, and I note that wealth is now in excess of 5 times GDP in the US; i.e. total wealth will have to drop 25–30% for equilibrium to be reestablished.
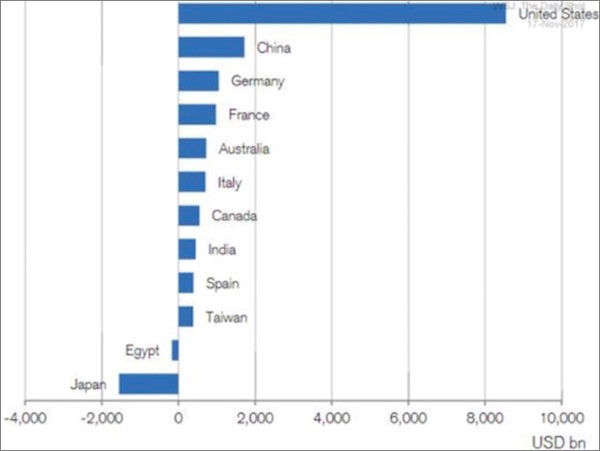
Change in total wealth, 2016–17 ($bn)
Source: Credit Suisse Global Wealth Data Book 2017, The Daily Shot
In other words, it is only a question of time before risk assets take a significant hit in the US, and I am prepared to stick my neck out and suggest that 2018 could be the year when the adjustment phase begins.
Having said that, one thing I also learned from the Japanese experience is that, when bubbles rage, asset prices can defy logic a lot longer than what you think is possible. There is absolutely no reason why the bubble cannot get even bigger before it eventually blows up, but blow up it will.
I agree with that last part. The stock bubble can get bigger and probably will, making the eventual implosion even more painful. As of now, bears are still easy to find, so we don’t seem to be near a capitulation point, but it is coming.
Lebowitz: Junk Bond Investors Will Be Wiped Out
One of my newer, favorite macro analysts is Michael Lebowitz of 720 Global. He has a way of cutting through the numerical fog to make important points jump out at you. You can read his full “Investment Outlook 2018” here. Below are some highlights.
I think Michael’s bond outlook is especially important. I bolded some key points below.
Investors looking for income in the safety of the Treasury market will die of thirst long before achieving their targets. Accordingly, many investors are reaching for additional yield in riskier categories, namely high yield credit and dividend-paying stocks. This game has been going on for a long time. Despite the relative yield enhancement those alternatives offer, the question of whether or not an investor is appropriately rewarded for taking that risk still exists.
Non-investment grade, or “junk” bond, yields range from 4% to 10%, depending on the company and sector, with the overall average yield at about 5.75%. A bond is relegated to junk status precisely because of the elevated risk of default. At current market yields, junk bonds pose an inordinate threat of record low recovery value and terminal realized yield. Using the average yield for junk bonds of 5.75%, an average default rate of 5% and a generous recovery rate of 50%, a high yield debt portfolio is mathematically identical to a risk-free asset with a yield of 3.25%. That amounts to a risk-adjusted premium of only 0.85% over 10-year Treasuries (3.25 – 2.40). A yield pickup of less than 1% is hardly compelling, especially when one considers [that] the downside from current valuation levels is immense.
Investors who think they get a nice yield boost from owning high yield debt are not considering the risk-adjusted outcomes. The risk-adjusted premium over Treasuries should be at least 200 to 300 basis points. Fixed-income portfolio allocations should reside predominantly in the defensive havens of high-quality sovereign, well-selected municipal and investment-grade corporate bonds. We recommend no allocation to junk.
As Michael says, many yield-seeking investors have jumped into junk bonds without fully weighing the risks. I’m very interested in that segment, too, but not yet. I’ll buy when yields are much higher and the risk-reward balance is more compelling.
Lewitt: Charts Point to Caution
Another favorite of mine who really should get more attention is Michael Lewitt. He writes The Credit Strategist, which always gives me good fodder for thought. Here are some excerpts from Michael’s January forecast issue.
Stocks: Last year, like many others, I underestimated the power of the bull market as central banks poured another $2 trillion into the markets. My 2017 prediction of an 1800-2400 range on the S&P 500 was way off as markets exhibited the lowest volatility in history and never experienced even a 3% correction. My range is very wide again in 2018 (3000/2300) and we could easily hit the high end of my range at some point during the year. The reason for this is that, despite the charts shown above, the structure of markets favors stocks – fewer shares outstanding due to stock buybacks, 50% fewer public companies today versus 20 years ago, few attractive fixed income alternatives, and ETFs and other passive strategies hoovering up huge amounts of mindless capital. There are fewer places for people to invest their money, and Wall Street makes it easier than ever to invest it in stocks with very little intellectual effort.
I expect higher volatility in 2018 as central banks tighten and stocks start to see more competition from the short end of the curve. I expect the VIX to trade at an average closer to 15 than 10 in 2018. There will be more opportunities for short sellers (if there are any left) to make money in 2018 while long-only and index investors will have a tougher go. It would be very surprising if 2018 were anywhere as easy as 2017 was for bulls (and if people thought their famous managers had trouble making money when the market was rising, how do they think they are going to do when the market is struggling?).
Bonds: I expect short rates to rise another 50–75 basis points as the Federal Reserve raises the Federal Funds rate three times in 2018. The 2/10 Treasury curve flattened by 65 basis points (to 53 basis points) in 2017 as the 10-year yield fell by four basis points (from 2.45% to 2.41%) and the 2-year rose by 69 basis points (from 1.19% to 1.88%).
The yield curve will likely flatten further and may come close to inverting as short rates keep rising and the 10-year yield squeezes closer to 3%, a level that may spook markets in a US economy carrying ~$60 trillion of combined public and private sector debt.
It is hard to see how 10-year yields won’t exceed 3% next year if 2-year rates track three 25-basis-point hikes in the Fed Funds rate, so this is something to watch very closely. If 10-year yields exceed 3%, stocks will likely react poorly; if they don’t, we will know that we are truly in the blow-off phase of a bubble.
That last part is key. I think a 3% yield with no credit risk in 10-year Treasury bonds could tempt many income-oriented investors out of stocks and corporate bonds. Why take equity risk in a market at historically high valuations for a 2% dividend yield (2% if you’re lucky)? Worse, yields at that level might start pulling pension money out of stocks, too. A 3% T-bond yield is quite reasonable if the Fed stays its present course.
Lacy Hunt: Caution Is Warranted
Lacy Hunt was at the conference in Hong Kong with me, and while he acknowledges that there is reason for optimism, he feels that in general the economy is likely to be slower this year than it was the last three quarters of last year.
Part of that is the savings rate, and part of it is the Fed’s having to reduce the monetary base in order to raise rates. That is just simply a drag on the economy
There seems to be a common theme among his and other forecasts that I have shared this week: Caution is warranted. The markets could go up a lot further, but be careful out there.
Get one of the world’s most widely read investment newsletters… free
Sharp macroeconomic analysis, big market calls, and shrewd predictions are all in a week’s work for visionary thinker and acclaimed financial expert John Mauldin. Since 2001, investors have turned to his Thoughts from the Frontline to be informed about what’s really going on in the economy. Join hundreds of thousands of readers, and get it free in your inbox every week.
John Mauldin Archive |
© 2005-2022 http://www.MarketOracle.co.uk - The Market Oracle is a FREE Daily Financial Markets Analysis & Forecasting online publication.