Another Technical Tool in the Markets Chart Analysis Toolbox!
InvestorEducation / Technical Analysis Dec 22, 2017 - 12:31 PM GMTBy: Peter_Degraaf
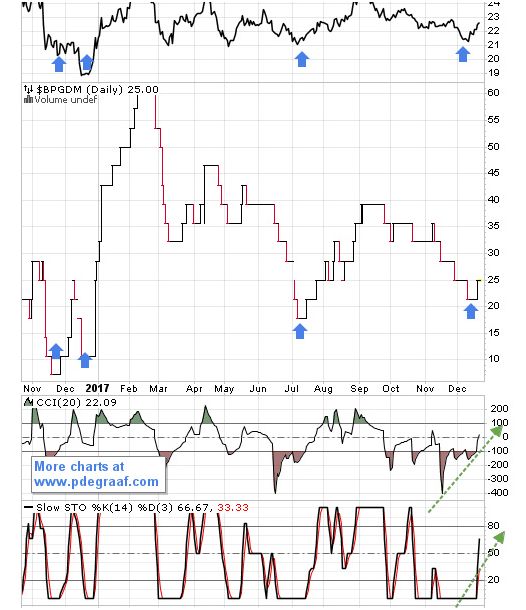
Charts are fascinating! They reflect human action. We look at charts for direction, for support and resistance. Here is a chart (courtesy Stockcharts.com) that is just now in the process of showing a buy signal for gold mining stocks.

Featured is $BPGDM. This index rises or falls according to the bullish percentage among the stocks that make up the index. At the top we have inserted GDX, the miners ETF. In the past, whenever $BPGDM rose up from below 25 it gave a buy signal for mining stocks. Notice how the blue arrows point to excellent timing. The supporting indicators at the bottom (CCI and Slow Sto) have just turned positive, to provide confirmation.
Peter Degraaf is NOT responsible for your trading decisions. Please do your own due diligence.
By Peter Degraaf
Peter Degraaf is an on-line stock trader with over 50 years of investing experience. He issues a weekend report on the markets for his many subscribers. For a sample issue send him an E-mail at itiswell@cogeco.net , or visit his website at www.pdegraaf.com where you will find many long-term charts, as well as an interesting collection of Worthwhile Quotes that make for fascinating reading.
© 2017 Copyright Peter Degraaf - All Rights Reserved
DISCLAIMER:Please do your own due diligence. Investing involves taking risks. I am not responsible for your investment decisions.
Peter Degraaf Archive |
© 2005-2022 http://www.MarketOracle.co.uk - The Market Oracle is a FREE Daily Financial Markets Analysis & Forecasting online publication.


