Most Popular
1. It’s a New Macro, the Gold Market Knows It, But Dead Men Walking Do Not (yet)- Gary_Tanashian
2.Stock Market Presidential Election Cycle Seasonal Trend Analysis - Nadeem_Walayat
3. Bitcoin S&P Pattern - Nadeem_Walayat
4.Nvidia Blow Off Top - Flying High like the Phoenix too Close to the Sun - Nadeem_Walayat
4.U.S. financial market’s “Weimar phase” impact to your fiat and digital assets - Raymond_Matison
5. How to Profit from the Global Warming ClImate Change Mega Death Trend - Part1 - Nadeem_Walayat
7.Bitcoin Gravy Train Trend Forecast 2024 - - Nadeem_Walayat
8.The Bond Trade and Interest Rates - Nadeem_Walayat
9.It’s Easy to Scream Stocks Bubble! - Stephen_McBride
10.Fed’s Next Intertest Rate Move might not align with popular consensus - Richard_Mills
Last 7 days
Stocks Correct into Bitcoin Happy Thanks Halving - Earnings Season Buying Opps - 4th July 24
24 Hours Until Clown Rishi Sunak is Booted Out of Number 10 - UIK General Election 2024 - 4th July 24
Clown Rishi Delivers Tory Election Bloodbath, Labour 400+ Seat Landslide - 1st July 24
Bitcoin Happy Thanks Halving - Crypto's Exist Strategy - 30th June 24
Is a China-Taiwan Conflict Likely? Watch the Region's Stock Market Indexes - 30th June 24
Gold Mining Stocks Record Quarter - 30th June 24
Could Low PCE Inflation Take Gold to the Moon? - 30th June 24
UK General Election 2024 Result Forecast - 26th June 24
AI Stocks Portfolio Accumulate and Distribute - 26th June 24
Gold Stocks Reloading - 26th June 24
Gold Price Completely Unsurprising Reversal and Next Steps - 26th June 24
Inflation – How It Started And Where We Are Now - 26th June 24
Can Stock Market Bad Breadth Be Good? - 26th June 24
How to Capitalise on the Robots - 20th June 24
Bitcoin, Gold, and Copper Paint a Coherent Picture - 20th June 24
Why a Dow Stock Market Peak Will Boost Silver - 20th June 24
QI Group: Leading With Integrity and Impactful Initiatives - 20th June 24
Tesla Robo Taxis are Coming THIS YEAR! - 16th June 24
Will NVDA Crash the Market? - 16th June 24
Inflation Is Dead! Or Is It? - 16th June 24
Investors Are Forever Blowing Bubbles - 16th June 24
Stock Market Investor Sentiment - 8th June 24
S&P 494 Stocks Then & Now - 8th June 24
As Stocks Bears Begin To Hibernate, It's Now Time To Worry About A Bear Market - 8th June 24
Gold, Silver and Crypto | How Charts Look Before US Dollar Meltdown - 8th June 24
Gold & Silver Get Slammed on Positive Economic Reports - 8th June 24
Gold Summer Doldrums - 8th June 24
S&P USD Correction - 7th June 24
Israel's Smoke and Mirrors Fake War on Gaza - 7th June 24
US Banking Crisis 2024 That No One Is Paying Attention To - 7th June 24
The Fed Leads and the Market Follows? It's a Big Fat MYTH - 7th June 24
How Much Gold Is There In the World? - 7th June 24
Is There a Financial Crisis Bubbling Under the Surface? - 7th June 24

Market Oracle FREE Newsletter

How to Protect your Wealth by Investing in AI Tech Stocks

WTI Crude Oil Elliott Wave Analysis

Commodities / Crude Oil Dec 14, 2017 - 01:05 PM GMT

By: Submissions

Commodities

Science Investing writes: Short Term Price Trend

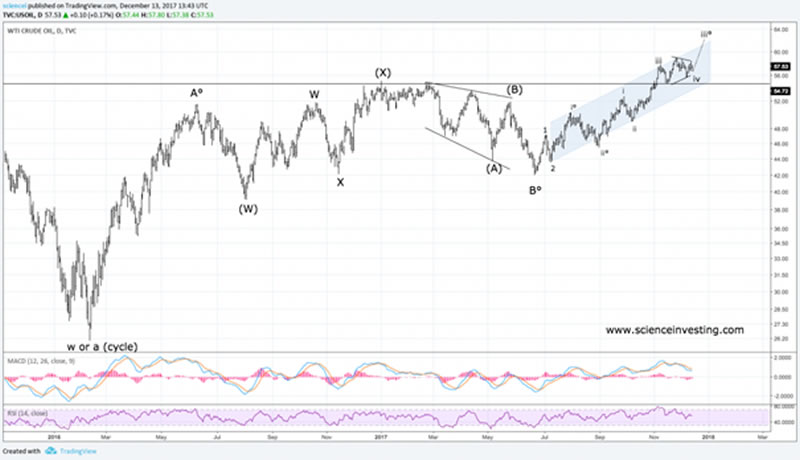
WTI crude oil started a bullish trend in June 2017. We forecast further upside in the crude oil complex.

For the past month we’ve witnessed a sideways movement in the WTI. It may have traced out a triangle pattern. The move from the 24th of November top looks complex, which is typical for a C-wave of a triangle. Triangles typically resolve into the direction of the greater trend. Hence we forecast price action to the upside short term.


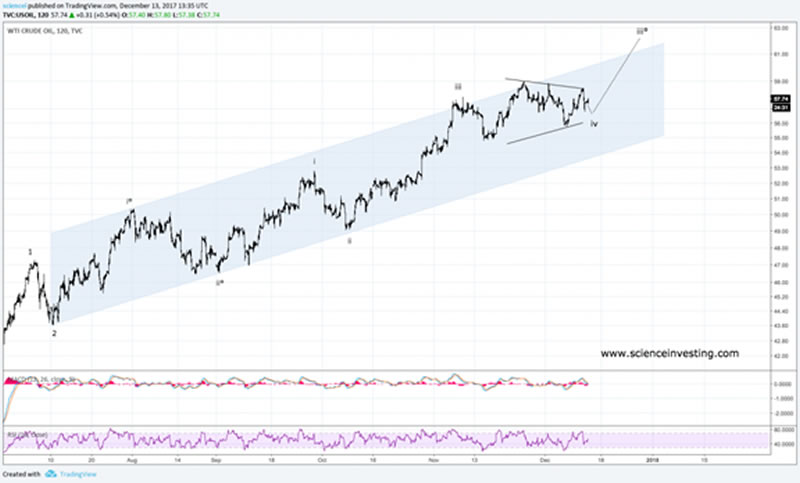
A triangle thrust will not put the lid on the WTI yet. The entire trend shows 9 waves to the upside from the starting point of the trend in June 2017. There is a wave overlap within the first 3 waves to the upside however. The conclusion to this is that we need to see at least 2 more up swings until we can count the uptrend in WTI oil complete.

Long Term Price Trend

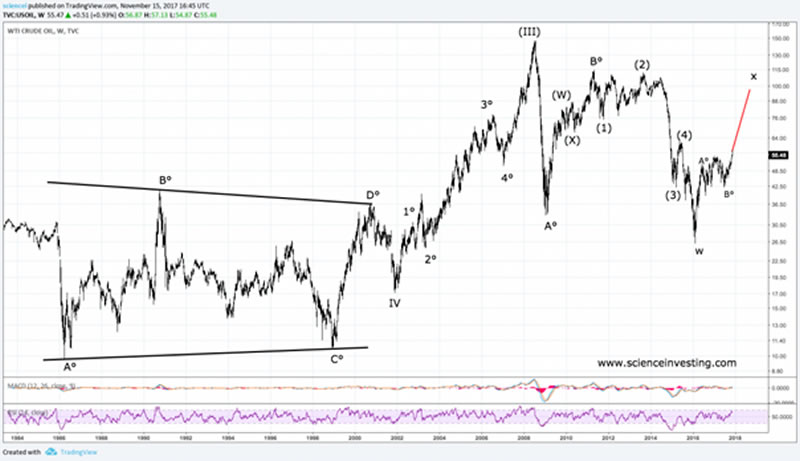
Price action has been exciting over the past couple of decades. WTI increased 15-fold from its levels in the late 90’s and had two magnificent crashes thereafter. We see crude oil to behave further in a complex manner. Mid term our wave analysis projects significant upside from the 2016 lows.

Long term there may be another few decades with crude oil in a trading range between $25 and $150. The sideways pattern makes also fundamental sense in a time when electric cars are waiting for their breakthrough and gas or alternative fuels compete with crude oil as an energy source. 

About The Author

Our background lies in economics and trading. We have been trained at reputable universities and worked as proprietary traders as well as portfolio managers throughout the past couple of decades. We started exploring the field of behavioral economics due to self-interest in the late 90’s. 

We experienced that the vast majority of publicly available financial market research either lacks quality or conflicts with other interests of the publisher. Our goal is to provide high quality analysis of liquid markets worldwide to the broad public. We’ve therefore launched recently our website.

Please visit us for more information:
www.scienceinvesting.com

© 2017 Science Investing - All Rights Reserved
Disclaimer: The above is a matter of opinion provided for general information purposes only and is not intended as investment advice. Information and analysis above are derived from sources and utilising methods believed to be reliable, but we cannot accept responsibility for any losses you may incur as a result of this analysis. Individuals should consult with their personal financial advisors.


© 2005-2022 http://www.MarketOracle.co.uk - The Market Oracle is a FREE Daily Financial Markets Analysis & Forecasting online publication.


Post Comment

Only logged in users are allowed to post comments. Register/ Log in