


Crude Oil and Negative Divergences
Commodities / Crude Oil Dec 06, 2017 - 07:57 AM GMTBy: Nadia_Simmons

 On Friday, crude oil increased and approached the November peak, but did this increase change anything in the broader perspective? Is it possible that the non-USD chart of crude oil give us more clues about black gold future moves?
Crude Oil’s Technical Picture
Let’s examine the technical picture of crude oil (charts courtesy of http://stockcharts.com).

Looking at the long-term chart of the commodity, we see that crude oil moved higher on Friday, which resulted in a re-test of the strength of the upper border of the blue rising trend channel. As you see, this important resistance withstood the buying pressure and in combination with the red, major resistance zone triggered a pullback.
What does it mean for light crude? As you know from our last week’s alerts, we believe that as long as there is no breakout above the above-mentioned key resistance area another bigger move to the upside is not likely to be seen and lower prices of black gold are still ahead of us (even if we have to show some patience first).
Having said that, let’s check what can what can we infer from the medium-term chart.
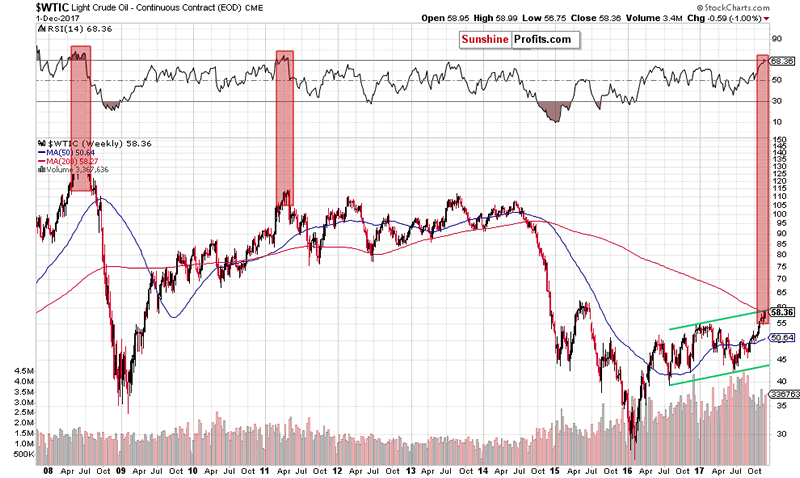
From this perspective, we see that the RSI climbed above the level of 70 only 3 times since almost 10 years. Such high reading of the indicator preceded the 2008 crude oil all time high and the May 2011 peak. In both these cases, we saw sizable declines in the following weeks, which suggests that history may repeat itself once again in the very near future – especially when we factor in the proximity to the major resistance zone marked on the long-term chart.
What’s interesting, we noticed one more negative situation on the non-USD (WTIC:UDN ratio) chart of crude oil. As a reminder, UDN is the symbol for the PowerShares DB US Dollar Index Bearish Fund, which moves in the exact opposite direction to the USD Index. Since the USD Index is a weighted average of the dollar's exchange rates with world's most important currencies, the WTIC:UDN ratio displays the value of crude oil priced in "other currencies".
Crude Oil from Non-USD Perspective
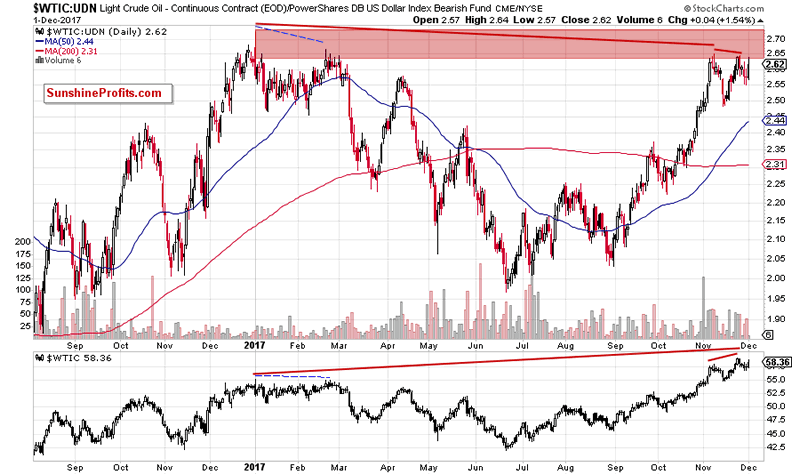
On the short-term chart, we noticed three negative divergences between the ratio and the price of crude oil priced in the U.S. dollars in 2017.
In many of our trading alerts you could read about the divergences between some indicator /indicators and the price of crude oil. The negative divergence (or the bear divergence) warns that the upward trend may end soon and appears when the price of the commodity rises to the new maximum, but the indicator hits its peak at a lower level than during the previous increase. Such situation is often considered as a sell signal and usually precedes declines.
What does this have in common with the above-mentioned divergences between the price of crude oil and the level of ratio? When we use the ratio in the same way as we use indicators, we think that we can get interesting clues about crude oil future moves.
As you see on the above chart, although black gold climbed above the January peak and hit a fresh 2017 high in the previous month, we didn’t see such breakout on the non-USD chart. Interestingly, on November 24, the ratio didn’t break above the previous peak creating another negative divergence. When we take a closer look at the chart, we can notice a similar situation at the beginning of the year. In February, crude oil increased above $55 and almost created a double top pattern. What happened at the same time with the ratio? It also moved higher, but visibly lower (we marked these situations with the blue dashed lines), creating a negative divergence. What happened next? After several days in the consolidation, crude oil and the ratio declined together, erasing around 60% of the November 2016-January 2017 upward move.
Taking into account the long-, the medium-term pictures and the above similarity between the current situation and what we saw at the beginning of the year, we think that reversal and declines in both cases (crude oil and the ratio) are very likely.
How low could crude oil go if oil bears show their strength in the coming weeks? In our opinion, if light crude extends losses from current levels, we’ll see (at least) a drop to around $54.81-$55.24, where the January peak and the mid-November lows are. If this support area is broken, the way to lever levels will be open.
Summing up, short positions continue to be justified from the risk/reward perspective as crude oil remains under the upper border of the blue rising trend channel seen on the monthly chart. Additionally, similarities between the current price action and what we saw at the beginning of the year (negative divergences between the ratio and the price of crude oil priced in the U.S. dollars) increases the probability of reversal and declines in the coming week(s).
Summing up, short (already profitable) positions are justified from the risk/reward perspective as crude oil invalidated the small breakout above the barrier of $50. This negative development together with the sell signals generated by the indicators suggests lower prices of the black gold in the coming days. If you enjoyed today’s analysis and you’d like to be updated on the following articles on crude oil, gold and other markets, we encourage you to sign up for our free mailing list. It’s free and if you don’t like it, you can easily unsubscribe. Sign up today.
Thank you.
Nadia Simmons
Forex & Oil Trading Strategist
Przemyslaw Radomski
Founder, Editor-in-chief
Sunshine Profits: Gold & Silver, Forex, Bitcoin, Crude Oil & Stocks
Stay updated: sign up for our free mailing list today
* * * * *
Disclaimer
All essays, research and information found above represent analyses and opinions of Nadia Simmons and Sunshine Profits' associates only. As such, it may prove wrong and be a subject to change without notice. Opinions and analyses were based on data available to authors of respective essays at the time of writing. Although the information provided above is based on careful research and sources that are believed to be accurate, Nadia Simmons and his associates do not guarantee the accuracy or thoroughness of the data or information reported. The opinions published above are neither an offer nor a recommendation to purchase or sell any securities. Nadia Simmons is not a Registered Securities Advisor. By reading Nadia Simmons’ reports you fully agree that he will not be held responsible or liable for any decisions you make regarding any information provided in these reports. Investing, trading and speculation in any financial markets may involve high risk of loss. Nadia Simmons, Sunshine Profits' employees and affiliates as well as members of their families may have a short or long position in any securities, including those mentioned in any of the reports or essays, and may make additional purchases and/or sales of those securities without notice.
© 2005-2022 http://www.MarketOracle.co.uk - The Market Oracle is a FREE Daily Financial Markets Analysis & Forecasting online publication.