


Oil markets turn bullish with shift to backwardation
Commodities / Crude Oil Nov 10, 2017 - 04:54 PM GMT

 This week both Brent Crude and WTI (Light Sweet Crude Oil) made a new price high in more than 2 years with Brent Crude rising to $64 per barrel and WTI to $57 per barrel. These price gains come before the OPEC’s meeting later this month on Nov 30. In the past two years, OPEC has imposed production cuts in its member countries in order to remove excess inventory and halt the price drop. In their last meeting on May, the cartel agreed to extend 1.8 million barrel a day cuts into the first quarter of 2018.
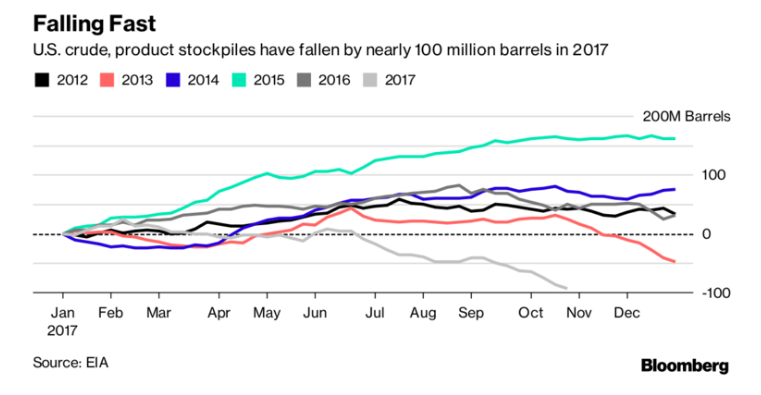
Recently, OPEC officials have given a signal that they will extend the production cuts beyond March 2018 at their next meeting in Vienna later this month. More importantly, this extension will occur at a time when the oil market has already tightened. The OPEC’s attempt to reduce the inventories appears to be bearing fruit. The chart below shows US crude and product inventories fall by 93.8 million barrels since the start of the year.
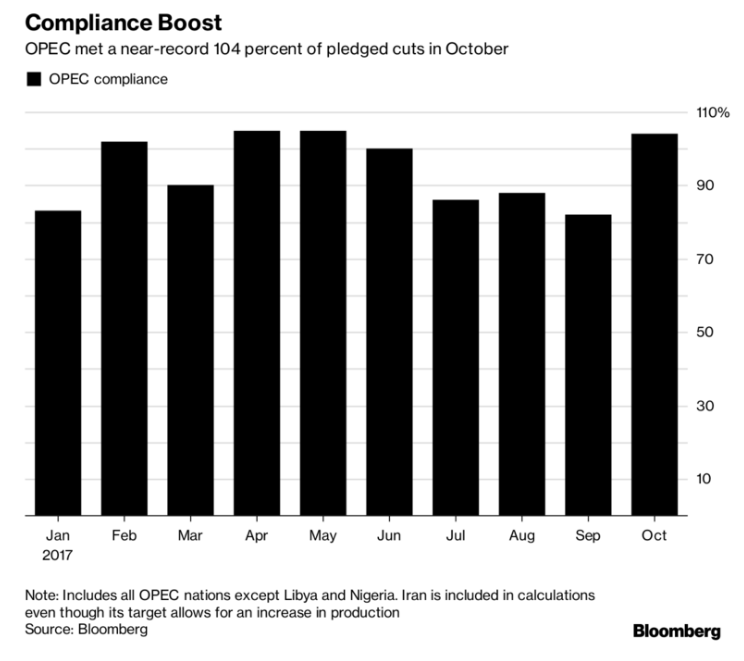
One of the reasons for this success is OPEC members’ compliance to the agreed upon production cuts from last year. In October, the compliance reaches 104% as the chart below shows
Further evidence that oil market is tightening could be found in oil futures market. Both Brent and WTI are now in the state of backwardation. This is a situation where the current price of oil for immediate shipment is higher than the price for future delivery. It signals that the market is tightening and discourage traders from stockpiling barrels. Conversely, contango is when the futures price of oil is higher than the current spot price. Brent has been in backwardation earlier this year, while WTI just recently moved to backwardation as the chart below shows:
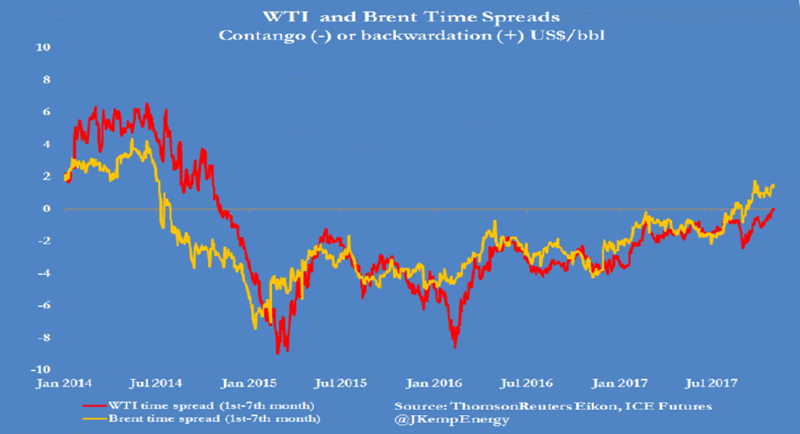
This shift to backwardation from contango have important implication. First of all, it suggests that OPEC’s production quotas in the past two years have been successful. Secondly, the shape of the oil curve is an important predictor of future returns. For example, subsequent four and 12 week returns for long oil future position in backwardated market have averaged 1.3% and 2.9%, respectively. In comparison, the same periods see a return of -1.7% and -3.8% on average during contango markets.
If OPEC can extend the production cuts through the remainder of 2018 in their next meeting, the bullish momentum in Oil could perhaps continue into 2018. With the market already tightening, an extension in the production quotas could further reduce any remaining excess supply and support oil spot price.
WTI (CL #F) Oil Long Term Chart
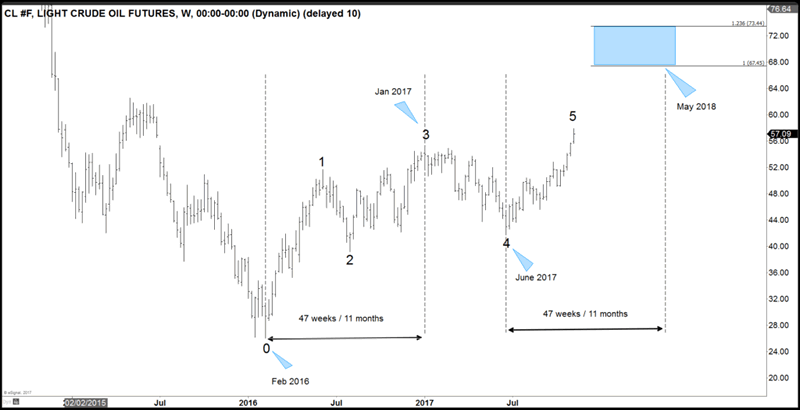
The Long Term chart of Oil shows a 5 swing bullish sequence from Feb 2016 low, favoring more upside. Please note a 5 swing sequence is different than 5 waves impulse. Oil is currently favored to extend higher in 7 swing towards $67.4 – $73.4 target. The length of time from Feb 2016 low (0) to Jan 2017 high (3) is 47 weeks or almost 11 months. If we assume Oil will take the same amount of time from June 2017 low (4), then adding 47 weeks will give us May 2018 as an estimated time for the $67.4 – $73.4 target.
If you enjoy this article, check our work and join Free 14 days Trial to see Elliott Wave Forecast in 78 instrument, as well as getting access to Live Trading Room, Live Session, and more
By Ayoub Ben Rejeb
https://elliottwave-forecast.com
ElliottWave-Forecast has built its reputation on accurate technical analysis and a winning attitude. By successfully incorporating the Elliott Wave Theory with Market Correlation, Cycles, Proprietary Pivot System, we provide precise forecasts with up-to-date analysis for 52 instruments including Forex majors & crosses, Commodities and a number of Equity Indices from around the World. Our clients also have immediate access to our proprietary Actionable Trade Setups, Market Overview, 1 Hour, 4 Hour, Daily & Weekly Wave Counts. Weekend Webinar, Live Screen Sharing Sessions, Daily Technical Videos, Elliott Wave Setup .
Copyright © 2017 ElliottWave-Forecast - All Rights Reserved Disclaimer: The above is a matter of opinion provided for general information purposes only and is not intended as investment advice. Information and analysis above are derived from sources and utilising methods believed to be reliable, but we cannot accept responsibility for any losses you may incur as a result of this analysis. Individuals should consult with their personal financial advisors.
© 2005-2022 http://www.MarketOracle.co.uk - The Market Oracle is a FREE Daily Financial Markets Analysis & Forecasting online publication.