


Gold Price in Q3 2017
Commodities / Gold and Silver 2017 Oct 08, 2017 - 11:56 AM GMTBy: Arkadiusz_Sieron

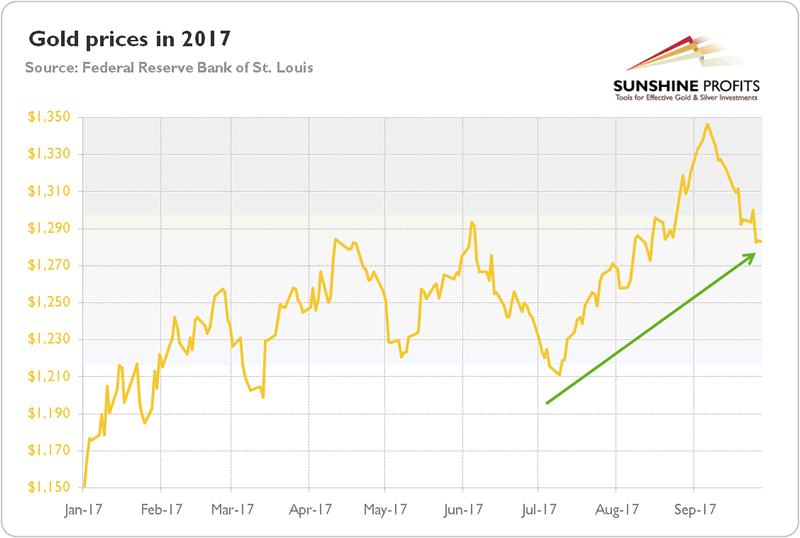
 The third quarter of 2017 was positive for the gold market. The yellow metal has gained more than 3 percent between July and the end of September. As one can see in the chart below, the price of gold jumped above $1,300 for a while and even approached the 2016 highs.
Chart 1: Gold prices (London P.M. Fix) from January to September 2017.
What were the reasons behind that impressive upward move? The popular story says that worries about North Korea triggered a rally in gold prices. However, as we showed in the September edition of the Market Overview, “gold’s reactions to geopolitical developments, including these about the country ruled by the Kim dynasty, are usually merely short-lived and limited.” Indeed, for example, although North Korea uttered new threats and launched another missile in the penultimate week of September, gold prices retreated.
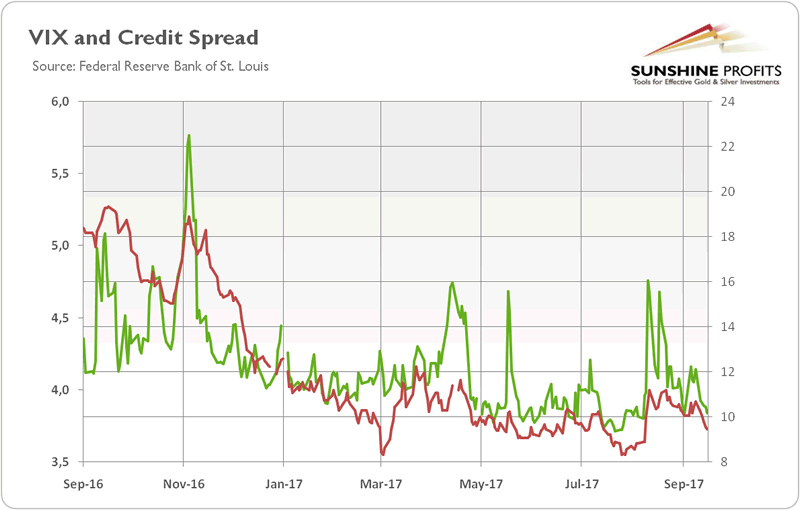
And, importantly, despite elevated geopolitical risks, global risky asset markets remain largely unaffected, while the market fear gauges are still very low. Both the CBOE Volatility Index and credit spreads increased in the first half of August, but the pricing of risk returned soon to very low levels, as the chart below shows.
Chart 2: The market volatility reflected by the CBOE Volatility Index (green line, right axis) and the credit spreads reflected by the BofA Merrill Lynch US High Yield-Option Adjusted Spread (red line, left axis, in %) over the last twelve months.
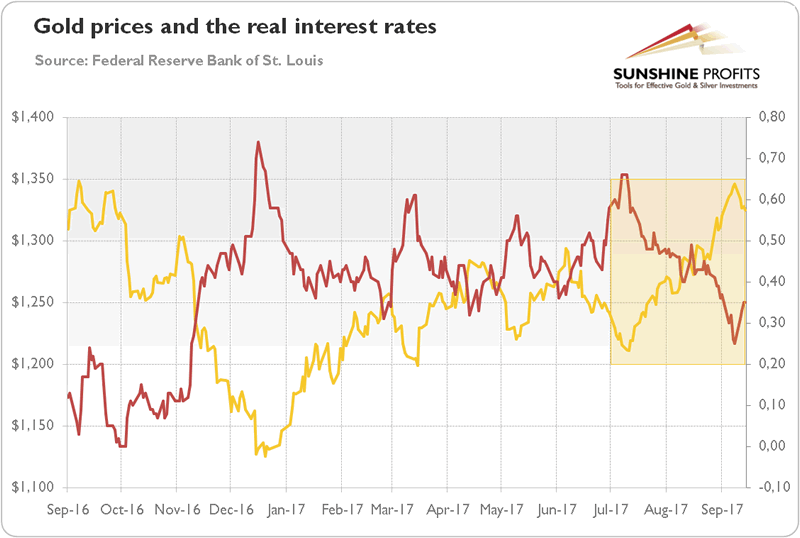
It implies that other factors – related to macroeconomics rather than geopolitics – had a bigger impact on gold in the analyzed period. In particular, the U.S. real interest rates and the greenback were the most important fundamental factors that influenced gold prices. Indeed, gold prices plotted in the chart below look like a mirror reflection of the moves in the real interest rates.
Chart 3: Gold prices (yellow line, left axis, P.M. London Fix) and the real interest rates (red line, right axis, yields on 10-year Treasury Inflation-Indexed Security, in %) over the last 12 months.
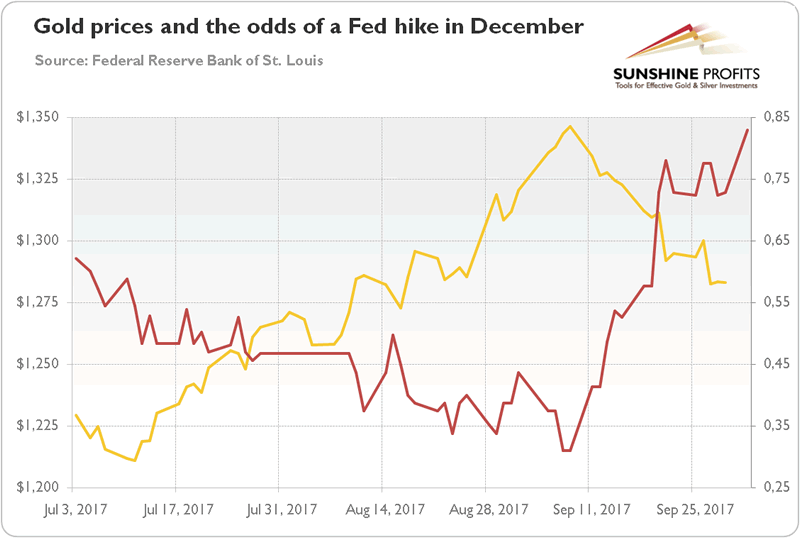
The drop in real interest rates in July and August was mostly caused by the decline in the market expectations of a Fed hike in December after dovish Yellen’s semiannual testimony before the Congress and the slowdown in inflation. The market odds of at least one 25 basis points upward move until December plunged from about 62.3 percent at the beginning of July to 31 percent at the beginning of September. Gold prices rallied then. But since then, the market chances rose to more than 80 percent at the end of month, while the price of the yellow metal retreated. The negative correlation between target rate probability history for the Fed meeting in December and gold prices is presented on the chart below.
Chart 4: Gold prices (yellow line, left axis, London P.M. Fix) and the market chances that the target for the federal funds rate will be higher than 100-125 basis points until December Fed meeting (red line, right axis).
The relationship between the U.S. dollar and gold in the third quarter of this year also looks like a mirror reflection (although they both moved in tandem at the beginning of July), as the chart below shows.
Chart 5: Gold prices (yellow line, left axis, London P.M. fix) and the U.S. dollar index (red line, right axis, trade weighted index against major currencies) from September 2016 to September 2017.
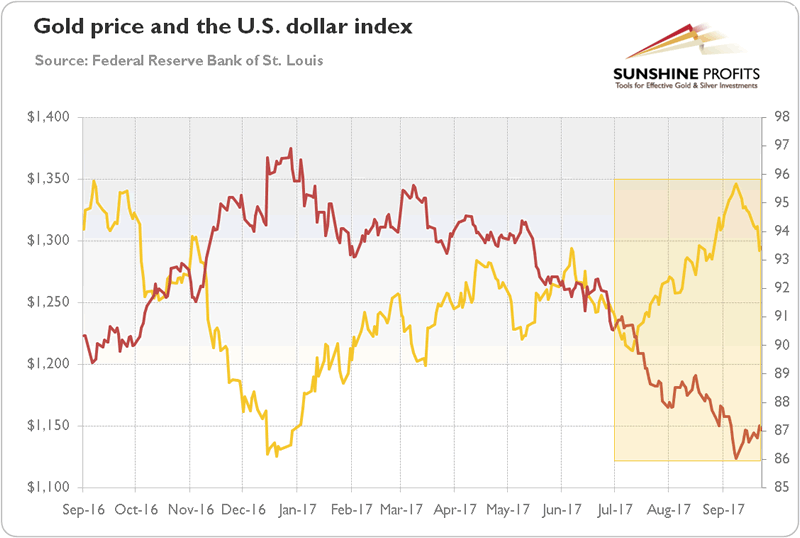
Actually, the collapse in the U.S. dollar has been the dominant macroeconomic theme recently. The greenback has been falling like a stone this year – and what initially looked like a correction turned into carnage during the summer. Importantly, the U.S. dollar has recently declined due to some geopolitical worries (such as crisis over Korean Peninsula) – while in the past it used to gain during periods of global uncertainty. This could suggest that the bull market in the greenback might have ended, which actually would be in line with the long-term pattern of seven-nine cycles in the U.S. currency. However, it could also mean that there were other factors that made the USD decline (for instance, the self-fulfilling prophecy regarding lower prices – USD declined for a long time thus everyone kept on selling it as it seemed to never recover). It goes without saying that worries about the removal of the debt ceiling and doubts whether the Trump administration would achieve any of its legislative promises in the near future do not help the dollar.
Having said that, the short-term prospects look more obvious. Before the September FOMC meeting, we wrote: “given the current level of speculative long positions, gold seems to be overbought (while the U.S. dollar oversold), so we could see a correction in the near term, especially if the Fed stays on its tightening course, as we believe that it does.” This is precisely what happened. Although the drop in gold prices in the aftermath of the recent FOMC meeting wore off a significant part of gold’s overbought status, there is room for further declines, at least until the Fed sends a dovish signal.
Thank you.
If you enjoyed the above analysis and would you like to know more about the gold ETFs and their impact on gold price, we invite you to read the April Market Overview report. If you're interested in the detailed price analysis and price projections with targets, we invite you to sign up for our Gold & Silver Trading Alerts . If you're not ready to subscribe at this time, we invite you to sign up for our gold newsletter and stay up-to-date with our latest free articles. It's free and you can unsubscribe anytime.
Arkadiusz Sieron
Sunshine Profits‘ Market Overview Editor
Disclaimer
All essays, research and information found above represent analyses and opinions of Przemyslaw Radomski, CFA and Sunshine Profits' associates only. As such, it may prove wrong and be a subject to change without notice. Opinions and analyses were based on data available to authors of respective essays at the time of writing. Although the information provided above is based on careful research and sources that are believed to be accurate, Przemyslaw Radomski, CFA and his associates do not guarantee the accuracy or thoroughness of the data or information reported. The opinions published above are neither an offer nor a recommendation to purchase or sell any securities. Mr. Radomski is not a Registered Securities Advisor. By reading Przemyslaw Radomski's, CFA reports you fully agree that he will not be held responsible or liable for any decisions you make regarding any information provided in these reports. Investing, trading and speculation in any financial markets may involve high risk of loss. Przemyslaw Radomski, CFA, Sunshine Profits' employees and affiliates as well as members of their families may have a short or long position in any securities, including those mentioned in any of the reports or essays, and may make additional purchases and/or sales of those securities without notice.
Arkadiusz Sieron Archive |
© 2005-2022 http://www.MarketOracle.co.uk - The Market Oracle is a FREE Daily Financial Markets Analysis & Forecasting online publication.