Most Popular
1. Banking Crisis is Stocks Bull Market Buying Opportunity - Nadeem_Walayat
2.The Crypto Signal for the Precious Metals Market - P_Radomski_CFA
3. One Possible Outcome to a New World Order - Raymond_Matison
4.Nvidia Blow Off Top - Flying High like the Phoenix too Close to the Sun - Nadeem_Walayat
5. Apple AAPL Stock Trend and Earnings Analysis - Nadeem_Walayat
6.AI, Stocks, and Gold Stocks – Connected After All - P_Radomski_CFA
7.Stock Market CHEAT SHEET - - Nadeem_Walayat
8.US Debt Ceiling Crisis Smoke and Mirrors Circus - Nadeem_Walayat
9.Silver Price May Explode - Avi_Gilburt
10.More US Banks Could Collapse -- A Lot More- EWI
Last 7 days
Stock Market Volatility (VIX) - 25th Mar 24
Stock Market Investor Sentiment - 25th Mar 24
The Federal Reserve Didn't Do Anything But It Had Plenty to Say - 25th Mar 24
Stock Market Breadth - 24th Mar 24
Stock Market Margin Debt Indicator - 24th Mar 24
It’s Easy to Scream Stocks Bubble! - 24th Mar 24
Stocks: What to Make of All This Insider Selling- 24th Mar 24
Money Supply Continues To Fall, Economy Worsens – Investors Don’t Care - 24th Mar 24
Get an Edge in the Crypto Market with Order Flow - 24th Mar 24
US Presidential Election Cycle and Recessions - 18th Mar 24
US Recession Already Happened in 2022! - 18th Mar 24
AI can now remember everything you say - 18th Mar 24
Bitcoin Crypto Mania 2024 - MicroStrategy MSTR Blow off Top! - 14th Mar 24
Bitcoin Gravy Train Trend Forecast 2024 - 11th Mar 24
Gold and the Long-Term Inflation Cycle - 11th Mar 24
Fed’s Next Intertest Rate Move might not align with popular consensus - 11th Mar 24
Two Reasons The Fed Manipulates Interest Rates - 11th Mar 24
US Dollar Trend 2024 - 9th Mar 2024
The Bond Trade and Interest Rates - 9th Mar 2024
Investors Don’t Believe the Gold Rally, Still Prefer General Stocks - 9th Mar 2024
Paper Gold Vs. Real Gold: It's Important to Know the Difference - 9th Mar 2024
Stocks: What This "Record Extreme" Indicator May Be Signaling - 9th Mar 2024
My 3 Favorite Trade Setups - Elliott Wave Course - 9th Mar 2024
Bitcoin Crypto Bubble Mania! - 4th Mar 2024
US Interest Rates - When WIll the Fed Pivot - 1st Mar 2024
S&P Stock Market Real Earnings Yield - 29th Feb 2024
US Unemployment is a Fake Statistic - 29th Feb 2024
U.S. financial market’s “Weimar phase” impact to your fiat and digital assets - 29th Feb 2024
What a Breakdown in Silver Mining Stocks! What an Opportunity! - 29th Feb 2024
Why AI will Soon become SA - Synthetic Intelligence - The Machine Learning Megatrend - 29th Feb 2024
Keep Calm and Carry on Buying Quantum AI Tech Stocks - 19th Feb 24

Market Oracle FREE Newsletter

How to Protect your Wealth by Investing in AI Tech Stocks

EURGBP Broke Out Of Price Channel And Formed Sideways Movement

Currencies / Euro Sep 29, 2017 - 03:55 PM GMT

By: Franco_Shao

Currencies

EURGBP recently broke out of a price channel on its 4-hour chart and moved sideways in a trading range between 0.8746 and 0.8899, suggesting that consolidation for the bearish movement from 0.9306 is underway.


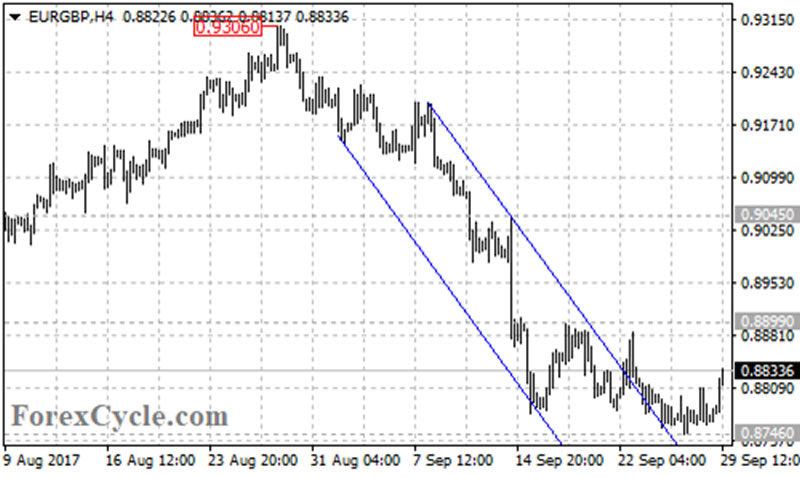
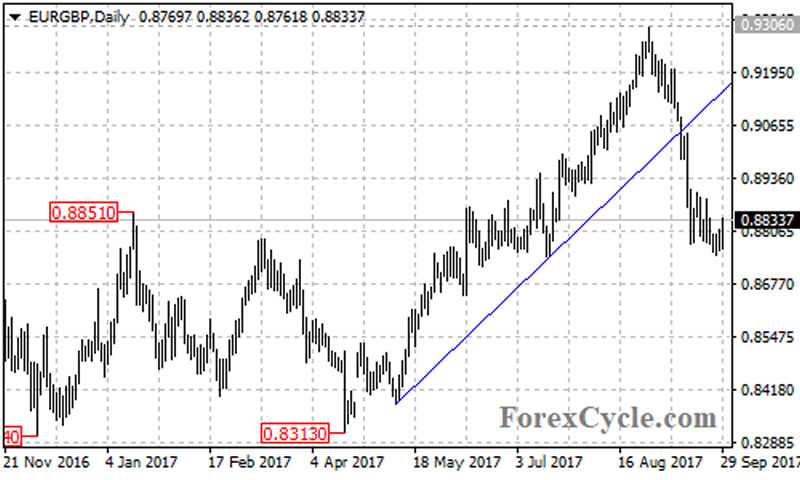
The EURGBP pair could be expected to continue its downside movement after the sideways consolidation and a breakdown 0.8746 support could signal resumption of the downtrend. Then the pair would find next support level at the 61.8% Fibonacci retracement taken from 0.8313 to 0.9306 at around 0.8690, followed by the 76.4% retracement at 0.8545.


On the other side, a break out of 0.8899 resistance could indicate that lengthier correction for the downtrend is needed, then the pair would find next resistance level at 0.9045. However, the 0.9045 level could be treated as key resistance for the downtrend, another fall could be seen before breaking above this level.

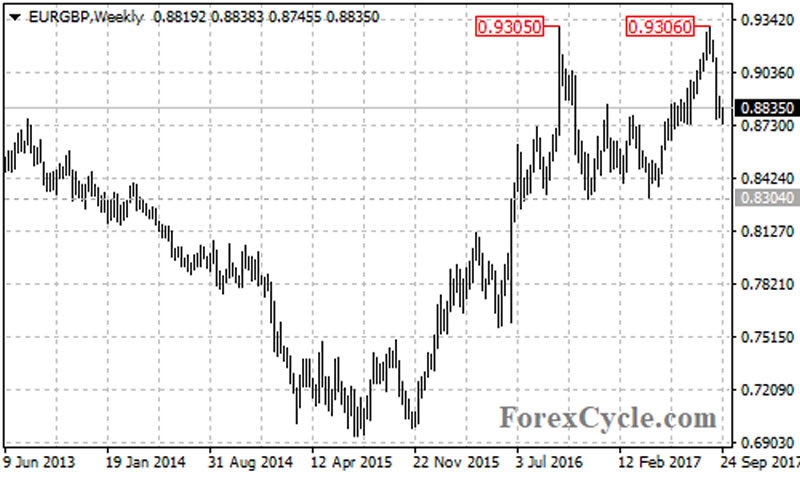
For long term analysis, the EURGBP pair failed in its two attempts to break through 0.9300 area, creating a double top pattern on its weekly chart with neckline at 0.8304. A breakdown below the neckline could confirm the reversal formation, then an additional measured movement could take price to 0.7300 area.


Technical levels

Support levels: 0.8746 (near term support), 0.8690 (the 61.8% Fibonacci retracement), 0.8545 (the 76.4% Fibonacci retracement), 0.8304 (the neckline of the double top pattern), 0.7300 (the measured move target).

Resistance levels: 0.8899 (near term resistance), 0.9045 (key resistance), 0.9306 (the August 29 high).

This article is written by Franco Shao, a senior analyst at ForexCycle.

© 2017 Copyright Franco Shao - All Rights Reserved Disclaimer: The above is a matter of opinion provided for general information purposes only and is not intended as investment advice. Information and analysis above are derived from sources and utilising methods believed to be reliable, but we cannot accept responsibility for any losses you may incur as a result of this analysis. Individuals should consult with their personal financial advisors.


© 2005-2022 http://www.MarketOracle.co.uk - The Market Oracle is a FREE Daily Financial Markets Analysis & Forecasting online publication.


Post Comment

Only logged in users are allowed to post comments. Register/ Log in