


GBPJPY Move Sideways On Weekly Chart
Currencies / British Pound Sep 12, 2017 - 03:20 PM GMTBy: Franco_Shao

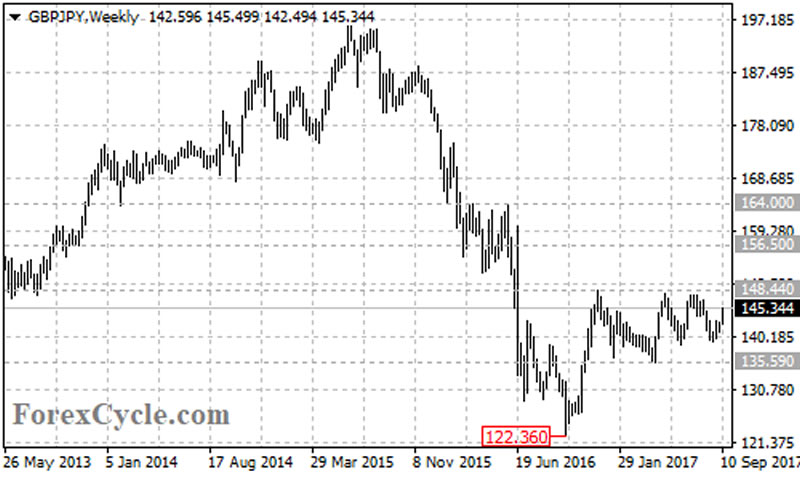
 GBPJPY moved sideways in a trading range between 135.59 and 148.44 for several months. The sideways movement is likely consolidation of the uptrend from 122.36. As long as 135.59 key support holds, the uptrend could be expected to resume and a breakout of 148.44 resistance could signal resumption of the uptrend.
On the upside
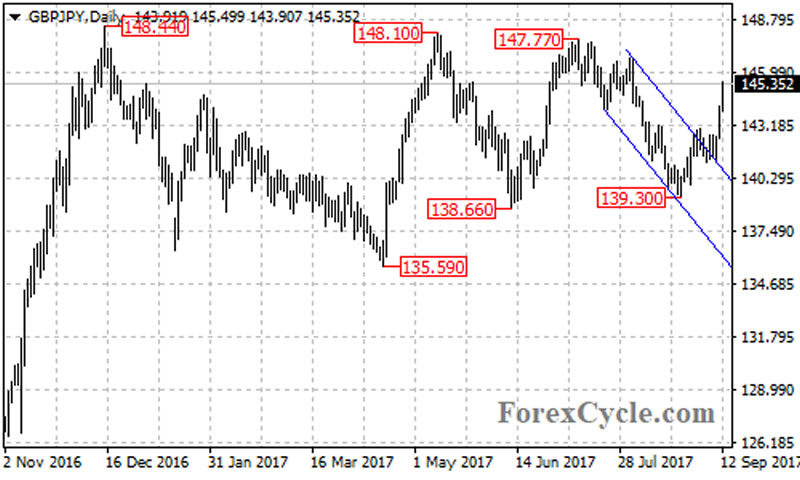
The GBPJPY pair broke above the top trend line of the price channel on the daily chart, indicating that the downside movement from 147.77 had completed at 139.30 already and the price is now in uptrend.
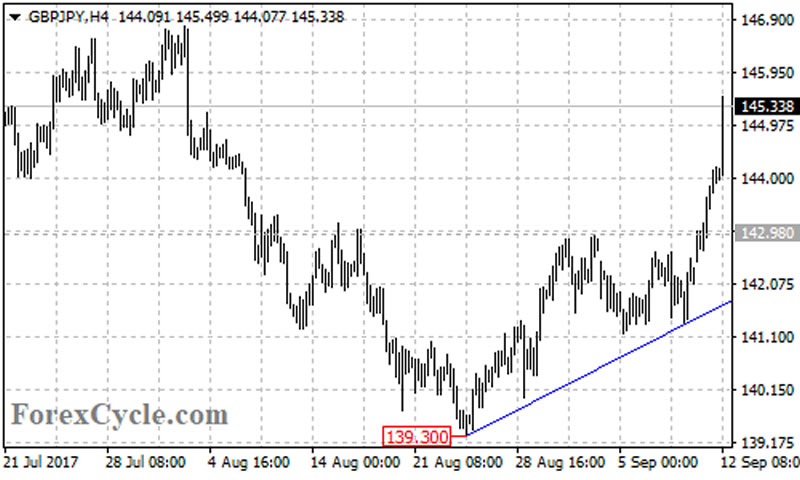
On the 4-hour chart, GBPJPY stays above a bullish trend now at around 141.70. As long as the price is above the trend line, the upside movement from 139.30 could be expected to continue, and further rise to test 148.44 resistance is possible. A break above this level will confirm that the upside movement from 122.36 has resumed, then next target would be at 156.50, followed by 164.00. The 164.00 level would be the final target of the uptrend.
On the downside
Near term support is at 142.98, followed by the bullish trend line on the 4-hour chart. A clear break below the trend line support could bring price back to test 1.3930 key support. Only a breakdown below this level could signal completion of the uptrend from 122.36.
Technical levels
Support levels: 142.98 (September 1 high), 141.70 (the bullish trend line on the 4-hour chart), 139.30 (August 24 low), 135.59 (April 17 low), 122.36 (October 2016 low).
Resistance levels: 148.44 (December 2016 high), 156.50, 164.00.
This article is written by Franco Shao, a senior analyst at ForexCycle.
© 2017 Copyright Franco Shao - All Rights Reserved Disclaimer: The above is a matter of opinion provided for general information purposes only and is not intended as investment advice. Information and analysis above are derived from sources and utilising methods believed to be reliable, but we cannot accept responsibility for any losses you may incur as a result of this analysis. Individuals should consult with their personal financial advisors.
© 2005-2022 http://www.MarketOracle.co.uk - The Market Oracle is a FREE Daily Financial Markets Analysis & Forecasting online publication.