Most Popular
1. It’s a New Macro, the Gold Market Knows It, But Dead Men Walking Do Not (yet)- Gary_Tanashian
2.Stock Market Presidential Election Cycle Seasonal Trend Analysis - Nadeem_Walayat
3. Bitcoin S&P Pattern - Nadeem_Walayat
4.Nvidia Blow Off Top - Flying High like the Phoenix too Close to the Sun - Nadeem_Walayat
4.U.S. financial market’s “Weimar phase” impact to your fiat and digital assets - Raymond_Matison
5. How to Profit from the Global Warming ClImate Change Mega Death Trend - Part1 - Nadeem_Walayat
7.Bitcoin Gravy Train Trend Forecast 2024 - - Nadeem_Walayat
8.The Bond Trade and Interest Rates - Nadeem_Walayat
9.It’s Easy to Scream Stocks Bubble! - Stephen_McBride
10.Fed’s Next Intertest Rate Move might not align with popular consensus - Richard_Mills
Last 7 days
S&P Stock Market Detailed Trend Forecast Into End 2024 - 25th Apr 24
US Presidential Election Year Equity Performance in the Presence of an Inverted Yield Curve- 25th Apr 24
Stock Market "Bullish Buzz" Reaches Highest Level in 53 Years - 25th Apr 24
Managing Your Public Image When Accused Of Allegations - 25th Apr 24
Friday Stock Market CRASH Following Israel Attack on Iranian Nuclear Facilities - 19th Apr 24
All Measures to Combat Global Warming Are Smoke and Mirrors! - 18th Apr 24
Cisco Then vs. Nvidia Now - 18th Apr 24
Is the Biden Administration Trying To Destroy the Dollar? - 18th Apr 24
S&P Stock Market Trend Forecast to Dec 2024 - 16th Apr 24
No Deposit Bonuses: Boost Your Finances - 16th Apr 24
Global Warming ClImate Change Mega Death Trend - 8th Apr 24
Gold Is Rallying Again, But Silver Could Get REALLY Interesting - 8th Apr 24
Media Elite Belittle Inflation Struggles of Ordinary Americans - 8th Apr 24
Profit from the Roaring AI 2020's Tech Stocks Economic Boom - 8th Apr 24
Stock Market Election Year Five Nights at Freddy's - 7th Apr 24
It’s a New Macro, the Gold Market Knows It, But Dead Men Walking Do Not (yet)- 7th Apr 24
AI Revolution and NVDA: Why Tough Going May Be Ahead - 7th Apr 24
Hidden cost of US homeownership just saw its biggest spike in 5 years - 7th Apr 24
What Happens To Gold Price If The Fed Doesn’t Cut Rates? - 7th Apr 24
The Fed is becoming increasingly divided on interest rates - 7th Apr 24
The Evils of Paper Money Have no End - 7th Apr 24
Stock Market Presidential Election Cycle Seasonal Trend Analysis - 3rd Apr 24
Stock Market Presidential Election Cycle Seasonal Trend - 2nd Apr 24
Dow Stock Market Annual Percent Change Analysis 2024 - 2nd Apr 24
Bitcoin S&P Pattern - 31st Mar 24
S&P Stock Market Correlating Seasonal Swings - 31st Mar 24
S&P SEASONAL ANALYSIS - 31st Mar 24
Here's a Dirty Little Secret: Federal Reserve Monetary Policy Is Still Loose - 31st Mar 24
Tandem Chairman Paul Pester on Fintech, AI, and the Future of Banking in the UK - 31st Mar 24
Stock Market Volatility (VIX) - 25th Mar 24
Stock Market Investor Sentiment - 25th Mar 24
The Federal Reserve Didn't Do Anything But It Had Plenty to Say - 25th Mar 24

Market Oracle FREE Newsletter

How to Protect your Wealth by Investing in AI Tech Stocks

EURJPY Might Be Forming Double Top Pattern

Currencies / Euro Sep 07, 2017 - 12:13 PM GMT

By: Franco_Shao

Currencies

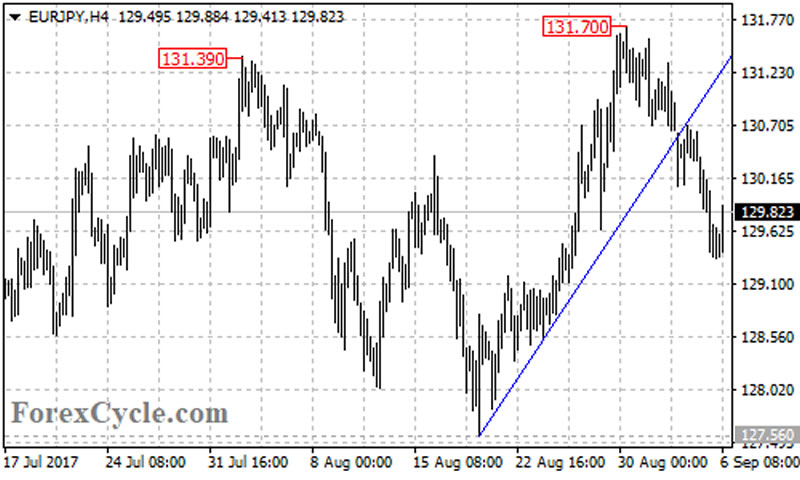
After touching 131.39 previous high resistance, EURJPY pulled back sharply from 131.70 and broke below a major support trend line on on the 4-hour chart. The pair might be forming a double top pattern with neckline at 127.56, a breakdown below this level could confirm the pattern.


On the downside

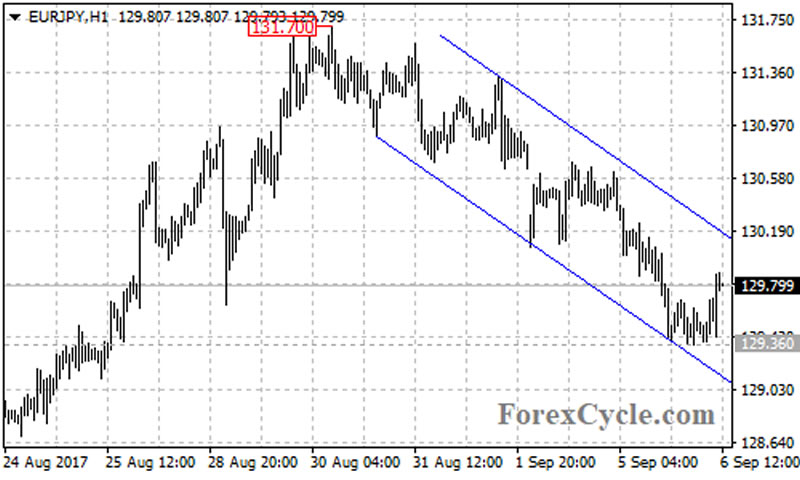
The EURJPY pair moved in a descending price channel on its 1-hour chart. As long as the price is in the channel, the bounce from 129.36 could be treated as consolidation of the downtrend from 131.70 and further decline towards 127.56 support is possible.


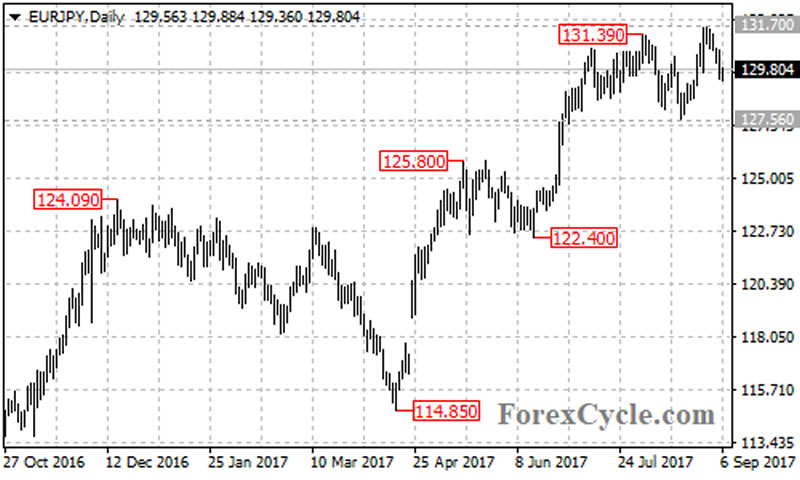
A breakdown below the neckline at 127.56 could indicate that the uptrend from 114.85 had completed at 131.70 already, then the following downside movement could take price back to next support level at 125.80, followed by 122.40.


On the upside

As long as 127.56 support holds, the price action from 131.39 would possibly be consolidation of the uptrend from 114.85, and another rise towards 133.50 is still possible after the consolidation, and this level should be the final target of the uptrend.

Near term resistance is at the top trend line of the price channel on the 1-hour chart now at around 130.20. A clear break above the channel resistance could bring price back towards 131.70, above this level could signal resumption of the uptrend from 114.85.

Technical levels

Support levels: 127.56 (key support), 125.80 (the May 16 high), 122.40 (the June 15 low), 121.20 (the 61.8% Fibonacci support).

Resistance levels: 130.20 (the top trend line of the price channel on the 1-hour chart), 131.70 (the August 30 high), 133.50 (the final target of the uptrend).

This article is written by Franco Shao, a senior analyst at ForexCycle.

© 2017 Copyright Franco Shao - All Rights Reserved Disclaimer: The above is a matter of opinion provided for general information purposes only and is not intended as investment advice. Information and analysis above are derived from sources and utilising methods believed to be reliable, but we cannot accept responsibility for any losses you may incur as a result of this analysis. Individuals should consult with their personal financial advisors.


© 2005-2022 http://www.MarketOracle.co.uk - The Market Oracle is a FREE Daily Financial Markets Analysis & Forecasting online publication.


Post Comment

Only logged in users are allowed to post comments. Register/ Log in