


How EIA Guestimates Keep Crude Oil Prices Subdued
Commodities / Crude Oil Sep 06, 2017 - 05:40 AM GMTBy: OilPrice_Com

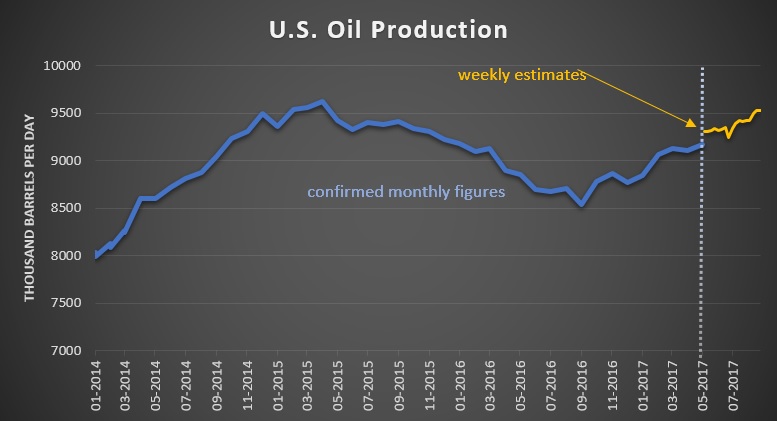
 The EIA has once again undercut its previous estimates for U.S. oil production, offering further evidence that the U.S. shale industry is not producing as much as everyone thinks.
The monthly EIA oil production figures tend to be more accurate than the weekly estimates, although they are published on several months after the fact. The EIA just released the latest monthly oil production figures for June, for example. Meanwhile, the agency releases production figures on a weekly basis that are only a week old – the latest figures run up right through August.
The weekly figures are more like guestimates though, less solid, but the best we can do in nearly real-time. It is not surprising that they are subsequently revised as time passes and the agency gets more accurate data.
But the problem is that for several months now, the monthly and the weekly data have diverged by non-trivial amounts. The weekly figures have been much higher than what the monthly data reveal only later. And remember, it is the monthly data that tends to be more accurate.
Let’s take a look. A month ago, I wrote about how the EIA’s monthly data for May put U.S. oil production at 9.169 million barrels per day (mb/d). But back in May, the EIA’s weekly figures told a different story. The agency thought at the time that the U.S. was producing nearly 200,000 bpd more than turned out to be the case. Here were the weekly estimates at the time:
• May 5: 9.314 mb/d
• May 12: 9.305 mb/d
• May 19: 9.320 mb/d
• May 26: 9.342 mb/d
But two months later, the EIA published its final estimate for May, and put the figure at 9.169 mb/d. So, as it turns out, the U.S. was producing much less in May than we thought at the time.
Now, the EIA has once again skewered its own weekly estimates. On August 31, it released monthly figures for June, and the discrepancy is even larger than the month before. The EIA says oil production in the U.S. actually declined in June, falling by 73,000 bpd to just 9.097 mb/d. Compare that to what the agency thought at the time with its weekly estimates:
• June 2: 9.318 mb/d
• June 9: 9.330 mb/d
• June 16: 9.350 mb/d
• June 23: 9.250 mb/d
• June 30: 9.338 mb/d
If those figures were correct, the U.S. would have averaged something like 9.317 mb/d for June. But the EIA now says that data was wrong, and in reality the figure should have been 9.097. In other words, in June, the U.S. produced 220,000 bpd less than we thought at the time.
This may seem like nitpicking, but it’s not exactly a tiny number. If that gap were to persist for the full-year, it’s nearly equivalent to half of what Saudi Arabia promised to cut as part of the OPEC deal, or substantially more than what the IEA expects Canada to add in new supplies this year.
More importantly, if the U.S. is actually producing much less than the market thinks, there is a much stronger bullish case for oil than conventional wisdom dictates. After all, there are massive shale production gains from the U.S. baked into oil price forecasts. For example, the EIA sees U.S. oil production surging from 9.3 mb/d this year to 9.9 mb/d in 2018, a gain of 600,000 bpd.
But the problem is that not only will it be difficult to reach that 9.9 mb/d, but it now looks like an uphill battle for the U.S. to reach that 9.3 mb/d figure in 2017. For the first six months of this year, the U.S. only averaged 9.071 mb/d. It will have to seriously ramp up production in order to reach that 9.3 mb/d estimate for the full-year. In reality, that looks very unlikely.
That means that ramping up to 9.9 mb/d next year would also appear out of reach, particularly since the shale industry seemed to stall out this summer. Production actually fell from May to June; the rig count has plateaued; some shale companies are already reporting some problems; the lingering effects of Hurricane Harvey will likely impact shale growth rates for months to come (although refinery outages are bearish in the near-term); and sub-$50 WTI prices will keep shale companies from recklessly spending more than they already are.
In short, the U.S. shale industry is on track to disappoint, which would mean there is a lot of upside risk to oil prices.
Link to original article: http://oilprice.com/Energy/Energy-General/How-EIA-Guestimates-Keep-Oil-Price-Subdued.html
By Nick Cunningham Oilprice.com
© 2017 Copyright OilPrice.com - All Rights Reserved
Disclaimer: The above is a matter of opinion provided for general information purposes only and is not intended as investment advice. Information and analysis above are derived from sources and utilising methods believed to be reliable, but we cannot accept responsibility for any losses you may incur as a result of this analysis. Individuals should consult with their personal financial advisors.
OilPrice.com Archive |
© 2005-2022 http://www.MarketOracle.co.uk - The Market Oracle is a FREE Daily Financial Markets Analysis & Forecasting online publication.