Most Popular
1. It’s a New Macro, the Gold Market Knows It, But Dead Men Walking Do Not (yet)- Gary_Tanashian
2.Stock Market Presidential Election Cycle Seasonal Trend Analysis - Nadeem_Walayat
3. Bitcoin S&P Pattern - Nadeem_Walayat
4.Nvidia Blow Off Top - Flying High like the Phoenix too Close to the Sun - Nadeem_Walayat
4.U.S. financial market’s “Weimar phase” impact to your fiat and digital assets - Raymond_Matison
5. How to Profit from the Global Warming ClImate Change Mega Death Trend - Part1 - Nadeem_Walayat
7.Bitcoin Gravy Train Trend Forecast 2024 - - Nadeem_Walayat
8.The Bond Trade and Interest Rates - Nadeem_Walayat
9.It’s Easy to Scream Stocks Bubble! - Stephen_McBride
10.Fed’s Next Intertest Rate Move might not align with popular consensus - Richard_Mills
Last 7 days
Bitcoin Price Swings Analysis - 9th May 24
Could Chinese Gold Be the Straw That Breaks the Dollar's Back? - 9th May 24
The Federal Reserve Is Broke! - 9th May 24
The Elliott Wave Crash Course - 9th May 24
Psychologically Prepared for Bitcoin Bull Market Bubble MANIA Rug Pull Corrections 2024 - 8th May 24
Why You Should Pay Attention to This Time-Tested Stock Market Indicator Now - 8th May 24
Copper: The India Factor - 8th May 24
Gold 2008 and 2022 All Over Again? Stocks, USDX - 8th May 24
Holocaust Survivor States Israel is Like Nazi Germany, The Fourth Reich - 8th May 24
Fourth Reich Invades Rafah Concentration Camp To Kill Palestinian Children - 8th May 24
THE GLOBAL WARMING CLIMATE CHANGE MEGA-TREND IS THE INFLATION MEGA-TREND! - 3rd May 24
Banxe Reviews: Revolutionising Financial Transactions with Innovative Solutions - 3rd May 24
MRNA - The beginning of the end of cancer? - 3rd May 24
The Future of Gaming: What's Coming Next? - 3rd May 24
What is A Split Capital Investment Trust? - 3rd May 24
AI Tech Stocks Earnings Season Stock Market Correction Opportunities - 29th Apr 24
The Federal Reserve's $34.5 Trillion Problem - 29th Apr 24
Inflation Still Runs Hot, Gold and Silver Prices Stabilize - 29th Apr 24
GOLD, OIL and WHEAT STOCKS - 29th Apr 24
Is Bitcoin Still an Asymmetric Opportunity? - 29th Apr 24
AI Tech Stocks Earnings Season Opportunities - 28th Apr 24
S&P Stock Market Detailed Trend Forecast Into End 2024 - 25th Apr 24
US Presidential Election Year Equity Performance in the Presence of an Inverted Yield Curve- 25th Apr 24
Stock Market "Bullish Buzz" Reaches Highest Level in 53 Years - 25th Apr 24

Market Oracle FREE Newsletter

How to Protect your Wealth by Investing in AI Tech Stocks

NZDUSD Broke Below 0.7200 Support

Currencies / Forex Trading Sep 01, 2017 - 06:49 PM GMT

By: Franco_Shao

Currencies

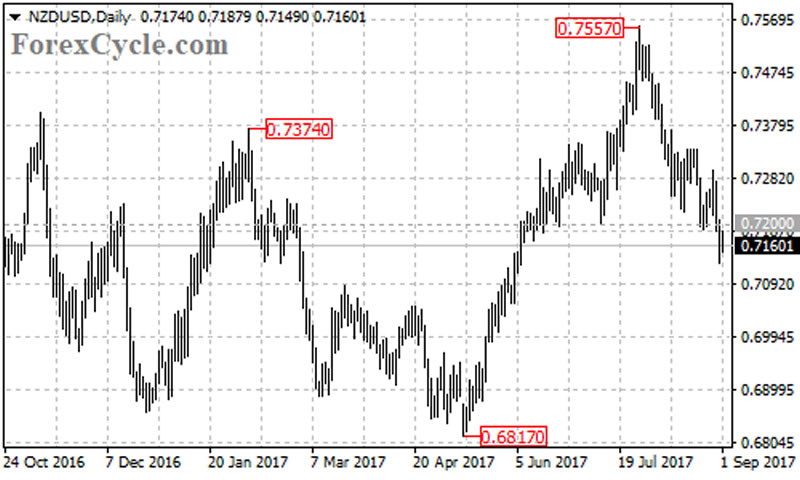
NZDUSD recently broke below a major support level at 0.7200, indicating that the uptrend from 0.6817 had completed at 0.7557 already. The pair is now in downtrend, further decline would likely be seen after correction.


On the downside

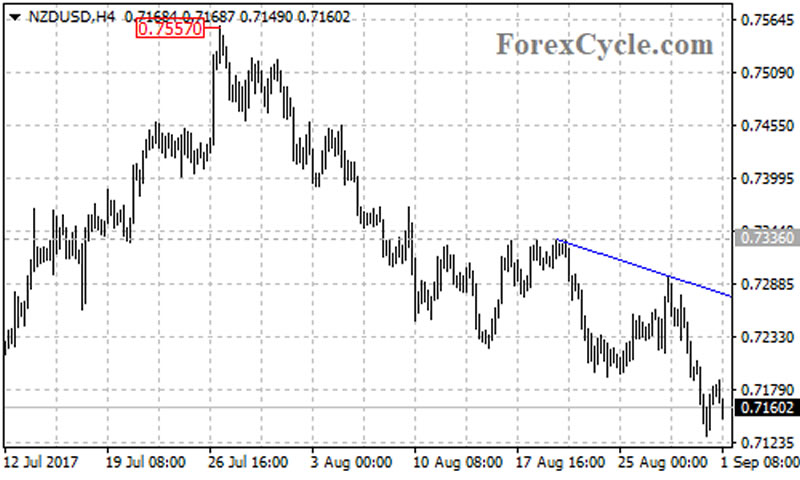
There is a bearish trend line on the 4-hour chart with resistance now at around 0.7280. As long as the price is below the trend line, the downside movement from 0.7557 could be expected to continue and next target would be at the 61.8% Fibonacci retracement taken from 0.6817 to 0.7557 at 0.7100, followed by the 76.4% retracement at 0.6990.


On the upside

A break of the support-turned-resistance level at 0.7200 could bring price back to test the resistance of the bearish trend line on the 4-hour chart. A clear break above the trend line resistance will suggest that correction for the downtrend from 0.7557 is underway, then the following upside movement could take price to next resistance level at 0.7336, followed by 0.7400.

For long term analysis

The NZDUSD pair might be forming a double top pattern with neckline at 0.6817 level on its weekly chart. A clear break below 0.6817 support level will confirm the double top pattern, then the measured move target would be at around 0.6100 area.

Technical levels

Support levels: 0.7100 (the 61.8% Fibonacci retracement), 0.6990 (the 76.4% Fibonacci retracement), 0.6817 (the May 11 low, the neckline of the double top pattern on the weekly chart).

Resistance levels: 0.7200 (the July 11 low, support-turned-resistance), 0.7280 (the bearish trend line on the 4-hour chart), 0.7336 (the August 21 high), 0.7400.

This article is written by Franco Shao, a senior analyst at ForexCycle.

© 2017 Copyright Franco Shao - All Rights Reserved Disclaimer: The above is a matter of opinion provided for general information purposes only and is not intended as investment advice. Information and analysis above are derived from sources and utilising methods believed to be reliable, but we cannot accept responsibility for any losses you may incur as a result of this analysis. Individuals should consult with their personal financial advisors.


© 2005-2022 http://www.MarketOracle.co.uk - The Market Oracle is a FREE Daily Financial Markets Analysis & Forecasting online publication.


Post Comment

Only logged in users are allowed to post comments. Register/ Log in