Most Popular
1. It’s a New Macro, the Gold Market Knows It, But Dead Men Walking Do Not (yet)- Gary_Tanashian
2.Stock Market Presidential Election Cycle Seasonal Trend Analysis - Nadeem_Walayat
3. Bitcoin S&P Pattern - Nadeem_Walayat
4.Nvidia Blow Off Top - Flying High like the Phoenix too Close to the Sun - Nadeem_Walayat
4.U.S. financial market’s “Weimar phase” impact to your fiat and digital assets - Raymond_Matison
5. How to Profit from the Global Warming ClImate Change Mega Death Trend - Part1 - Nadeem_Walayat
7.Bitcoin Gravy Train Trend Forecast 2024 - - Nadeem_Walayat
8.The Bond Trade and Interest Rates - Nadeem_Walayat
9.It’s Easy to Scream Stocks Bubble! - Stephen_McBride
10.Fed’s Next Intertest Rate Move might not align with popular consensus - Richard_Mills
Last 7 days
THE GLOBAL WARMING CLIMATE CHANGE MEGA-TREND IS THE INFLATION MEGA-TREND! - 3rd May 24
Banxe Reviews: Revolutionising Financial Transactions with Innovative Solutions - 3rd May 24
MRNA - The beginning of the end of cancer? - 3rd May 24
The Future of Gaming: What's Coming Next? - 3rd May 24
What is A Split Capital Investment Trust? - 3rd May 24
AI Tech Stocks Earnings Season Stock Market Correction Opportunities - 29th Apr 24
The Federal Reserve's $34.5 Trillion Problem - 29th Apr 24
Inflation Still Runs Hot, Gold and Silver Prices Stabilize - 29th Apr 24
GOLD, OIL and WHEAT STOCKS - 29th Apr 24
Is Bitcoin Still an Asymmetric Opportunity? - 29th Apr 24
AI Tech Stocks Earnings Season Opportunities - 28th Apr 24
S&P Stock Market Detailed Trend Forecast Into End 2024 - 25th Apr 24
US Presidential Election Year Equity Performance in the Presence of an Inverted Yield Curve- 25th Apr 24
Stock Market "Bullish Buzz" Reaches Highest Level in 53 Years - 25th Apr 24
Managing Your Public Image When Accused Of Allegations - 25th Apr 24
Friday Stock Market CRASH Following Israel Attack on Iranian Nuclear Facilities - 19th Apr 24
All Measures to Combat Global Warming Are Smoke and Mirrors! - 18th Apr 24
Cisco Then vs. Nvidia Now - 18th Apr 24
Is the Biden Administration Trying To Destroy the Dollar? - 18th Apr 24
S&P Stock Market Trend Forecast to Dec 2024 - 16th Apr 24
No Deposit Bonuses: Boost Your Finances - 16th Apr 24
Global Warming ClImate Change Mega Death Trend - 8th Apr 24
Gold Is Rallying Again, But Silver Could Get REALLY Interesting - 8th Apr 24
Media Elite Belittle Inflation Struggles of Ordinary Americans - 8th Apr 24
Profit from the Roaring AI 2020's Tech Stocks Economic Boom - 8th Apr 24
Stock Market Election Year Five Nights at Freddy's - 7th Apr 24
It’s a New Macro, the Gold Market Knows It, But Dead Men Walking Do Not (yet)- 7th Apr 24
AI Revolution and NVDA: Why Tough Going May Be Ahead - 7th Apr 24
Hidden cost of US homeownership just saw its biggest spike in 5 years - 7th Apr 24
What Happens To Gold Price If The Fed Doesn’t Cut Rates? - 7th Apr 24
The Fed is becoming increasingly divided on interest rates - 7th Apr 24
The Evils of Paper Money Have no End - 7th Apr 24

Market Oracle FREE Newsletter

How to Protect your Wealth by Investing in AI Tech Stocks

Will the Ethereum Crash Continue?

Currencies / BlockChain Jul 13, 2017 - 12:43 PM GMT

By: Franco_Shao

Currencies

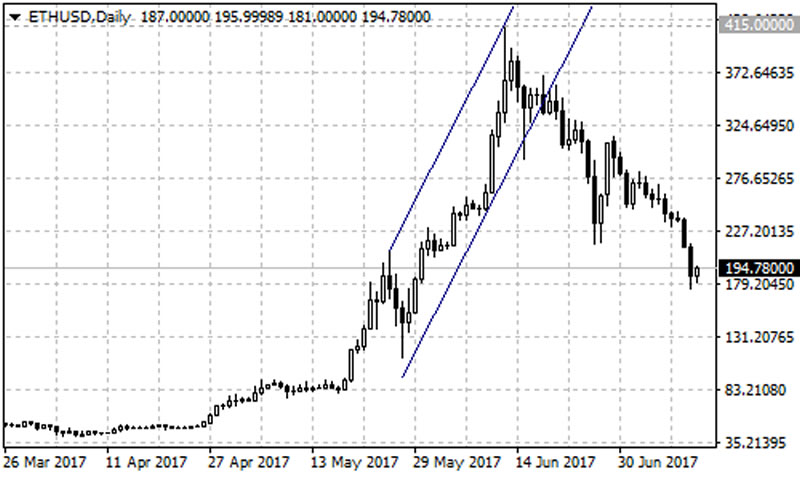
After hitting a highest record at 415, ETHUSD broke below the bullish price channel on its daily chart and fell sharply to as low as 175.50. Will the Ethereum crash continue?


Let’s look into its 4-hour chart, the Ethereum stays below a bearish trend line from the June 12 high of 415 to the June 29 high of 314.80 with resistance at around 234. As long as the price is below the trend line, we would expect the downtrend to continue, and further decline to test the support of the 61.8% Fibonacci retracement taken from 0 to 415 at around 156 is possible in the coming days. A breakdown below this level could take price to the next support level of the 20-week moving average at around 135.

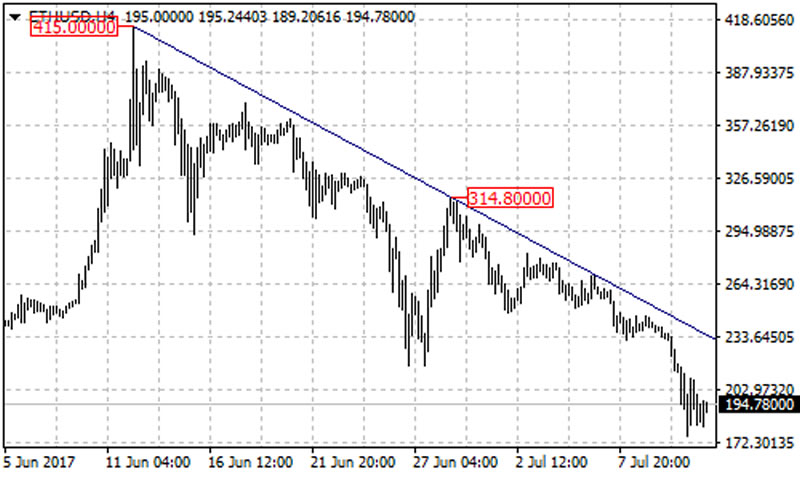
Near term resistance is at 210, a break of this level could bring price back to the bearish trend line on the 4-hour chart. The key resistance is located at the trend line, if the price breaks and settles above the trend line resistance, it would confirm that the downtrend from 415 is complete, then following upside movement could bring price back to the next resistance level of 314.80.

For long term analysis, the fall from 415 would possibly be correction of the long term uptrend and a clear break above the bearish trend line could signal resumption of the uptrend.

Technical levels

Support levels: 156 (the 61.8% Fibonacci retracement), 135 (the 20-week moving average).

Resistance levels: 210 (near term resistance), 234 (the bearish trend line on the 4-hour chart), 314.80 (the June 29 high), 415 (the June 12 high).

This article is written by Franco Shao, a senior analyst at ForexCycle.

© 2017 Copyright Franco Shao - All Rights Reserved Disclaimer: The above is a matter of opinion provided for general information purposes only and is not intended as investment advice. Information and analysis above are derived from sources and utilising methods believed to be reliable, but we cannot accept responsibility for any losses you may incur as a result of this analysis. Individuals should consult with their personal financial advisors.


© 2005-2022 http://www.MarketOracle.co.uk - The Market Oracle is a FREE Daily Financial Markets Analysis & Forecasting online publication.


Post Comment

Only logged in users are allowed to post comments. Register/ Log in