Most Popular
1. It’s a New Macro, the Gold Market Knows It, But Dead Men Walking Do Not (yet)- Gary_Tanashian
2.Stock Market Presidential Election Cycle Seasonal Trend Analysis - Nadeem_Walayat
3. Bitcoin S&P Pattern - Nadeem_Walayat
4.Nvidia Blow Off Top - Flying High like the Phoenix too Close to the Sun - Nadeem_Walayat
4.U.S. financial market’s “Weimar phase” impact to your fiat and digital assets - Raymond_Matison
5. How to Profit from the Global Warming ClImate Change Mega Death Trend - Part1 - Nadeem_Walayat
7.Bitcoin Gravy Train Trend Forecast 2024 - - Nadeem_Walayat
8.The Bond Trade and Interest Rates - Nadeem_Walayat
9.It’s Easy to Scream Stocks Bubble! - Stephen_McBride
10.Fed’s Next Intertest Rate Move might not align with popular consensus - Richard_Mills
Last 7 days
S&P Stock Market Trend Forecast to Dec 2024 - 16th Apr 24
No Deposit Bonuses: Boost Your Finances - 16th Apr 24
Global Warming ClImate Change Mega Death Trend - 8th Apr 24
Gold Is Rallying Again, But Silver Could Get REALLY Interesting - 8th Apr 24
Media Elite Belittle Inflation Struggles of Ordinary Americans - 8th Apr 24
Profit from the Roaring AI 2020's Tech Stocks Economic Boom - 8th Apr 24
Stock Market Election Year Five Nights at Freddy's - 7th Apr 24
It’s a New Macro, the Gold Market Knows It, But Dead Men Walking Do Not (yet)- 7th Apr 24
AI Revolution and NVDA: Why Tough Going May Be Ahead - 7th Apr 24
Hidden cost of US homeownership just saw its biggest spike in 5 years - 7th Apr 24
What Happens To Gold Price If The Fed Doesn’t Cut Rates? - 7th Apr 24
The Fed is becoming increasingly divided on interest rates - 7th Apr 24
The Evils of Paper Money Have no End - 7th Apr 24
Stock Market Presidential Election Cycle Seasonal Trend Analysis - 3rd Apr 24
Stock Market Presidential Election Cycle Seasonal Trend - 2nd Apr 24
Dow Stock Market Annual Percent Change Analysis 2024 - 2nd Apr 24
Bitcoin S&P Pattern - 31st Mar 24
S&P Stock Market Correlating Seasonal Swings - 31st Mar 24
S&P SEASONAL ANALYSIS - 31st Mar 24
Here's a Dirty Little Secret: Federal Reserve Monetary Policy Is Still Loose - 31st Mar 24
Tandem Chairman Paul Pester on Fintech, AI, and the Future of Banking in the UK - 31st Mar 24
Stock Market Volatility (VIX) - 25th Mar 24
Stock Market Investor Sentiment - 25th Mar 24
The Federal Reserve Didn't Do Anything But It Had Plenty to Say - 25th Mar 24

Market Oracle FREE Newsletter

How to Protect your Wealth by Investing in AI Tech Stocks

Kuwait Stock Exchange Index (KWSE): Watch out below!

Stock-Markets / Middle East Jul 03, 2017 - 06:56 AM GMT

By: MarketsToday

Stock-Markets

The Kuwait Stock Exchange Index (KWSE) is sitting on the edge of a cliff. We may soon see a decisive reversal of the uptrend begun from the January 2016 low. Following the January 2016 low the KWSE advanced as much as 44.4 per cent as of the 7,091.46 peak reached in early-April. That high completed a 61.8% Fibonacci retracement of the long-term downtrend.

During the rally the index moved well above the pivotal 40-week exponential moving average (ema), and as of January broke out above the long-term downtrend line. This is all bullish behavior for the long-term.


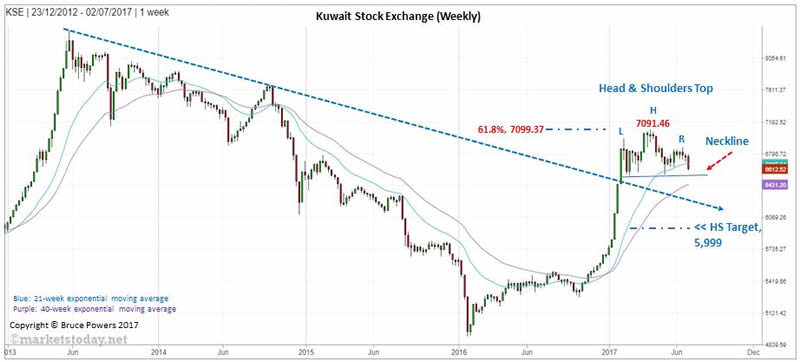
Nevertheless, over the past five months a well formed potential head and shoulders top trend reversal pattern has formed. The right shoulder is lower than the left. This reflects increasing selling pressure as the rally defining the left shoulder was formed, and therefore increases the odds that the pattern could give a bearish signal soon.

There is no confirmation that the pattern will lead to a bearish move until there is a trigger below the neckline. This will occur on a drop below 6,545. At that point selling pressure should intensify. Weakness is confirmed on a daily close below 6,534, the low of the head and shoulders pattern.

Once triggered there is a good chance of at least reaching the 38.2% Fibonacci retracement at 6,258.73 before seeing support that could lead to a tradeable bounce. However, the minimum target derived from the topping pattern is 5,999. That’s an interesting price because if it is reached a 50% retracement of the full uptrend will have also been completed. The 50% mark is at 6,001.50.

The above bearish scenario becomes suspect if we see a daily close above the right shoulder high at 6,867.62. (www.marketstoday.net/en/)

Bruce Powers, CMT
Chief Technical Analyst
http://www.marketstoday.net/

© 2017 Copyright Bruce Powers- All Rights Reserved

Disclaimer: The above is a matter of opinion provided for general information purposes only and is not intended as investment advice. Information and analysis above are derived from sources and utilising methods believed to be reliable, but we cannot accept responsibility for any losses you may incur as a result of this analysis. Individuals should consult with their personal financial advisors.


© 2005-2022 http://www.MarketOracle.co.uk - The Market Oracle is a FREE Daily Financial Markets Analysis & Forecasting online publication.


Post Comment

Only logged in users are allowed to post comments. Register/ Log in