


Heating Oil Bottom Is In.(probably)
Commodities / Commodities Trading Jun 16, 2017 - 08:02 AM GMTBy: Stephen_Cox

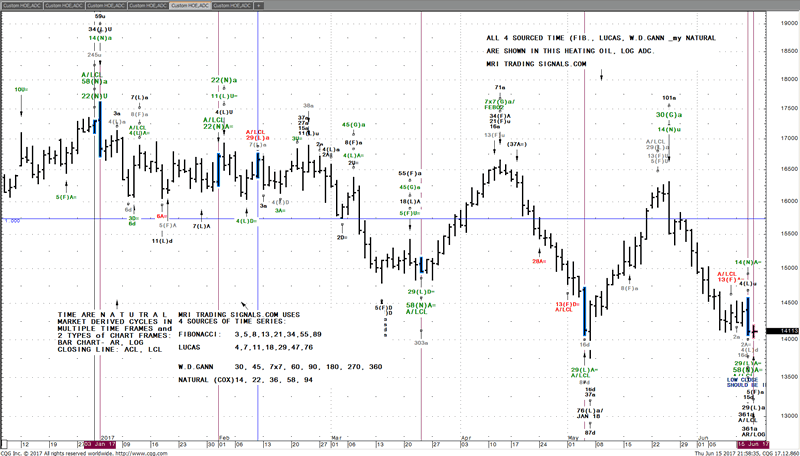
 MRI Trading Signals has identified a high probability of a HEATING OIL LOW, at least for awhile. It may be a stretch to see the nearby HON 17 (141.13) close above the previous week’s close 143.70, requiring a 2.57+ net change on Friday. IF that happens then HO is confirming the WEEKLY TIME SETUP in the ACL and LCL Closing Line Chart Frames- 3D, 5(F)A, 13(F)a and 30(G)a to WK 07 NOV’16 and 45(G)a to WK 25 JUL’16.
In the Active WEEKLY AR and LOG Bar Chart Frames THIS WEEK is a TIME EQUALITY 3D= 3u, 6a, plus 30(G)a to WK 14 NOV’16 and 45(G)a to WK 01 AUG’16.
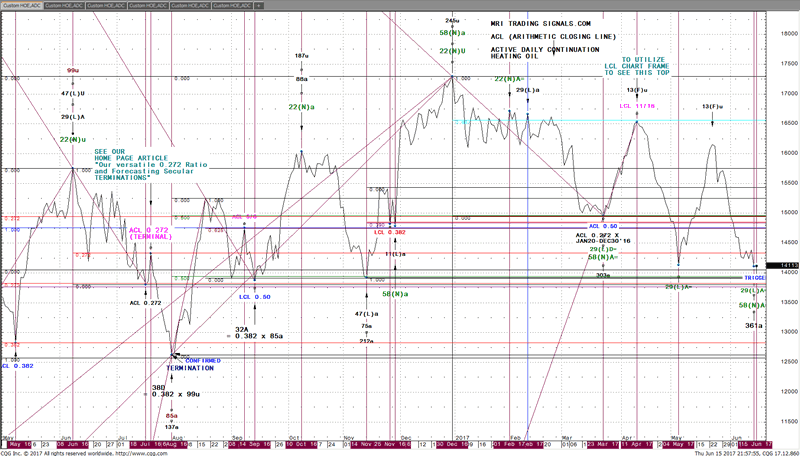
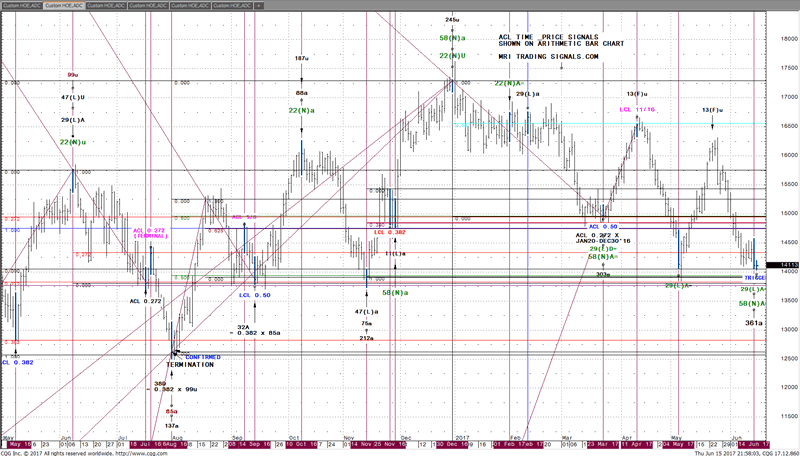
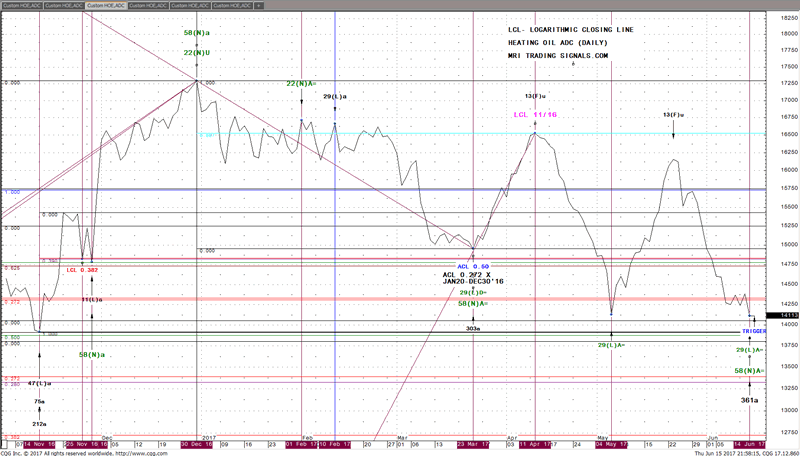
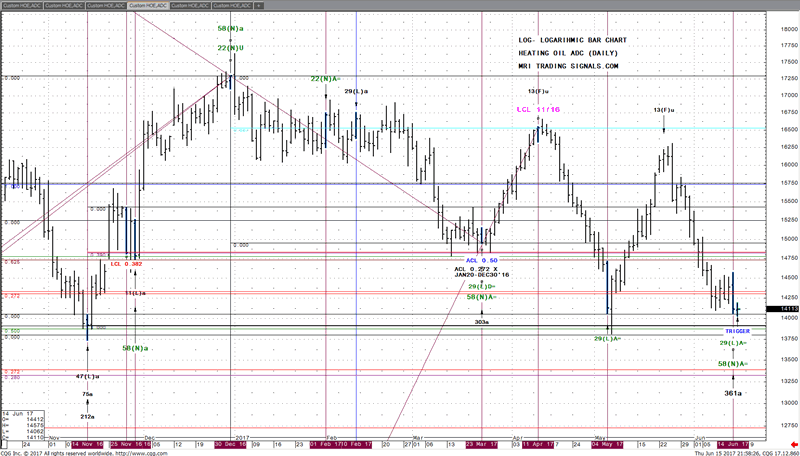
Let’s take an MRI 3D look at what TIME has to say in the Daily HEATING OIL. The viewer is always looking at both ACL/LCL Closing Lines and AR/LOG Bars.
HO (Daily) TIME A/LCL
HO (Daily) TIME AR/LOG
HO (Daily) TIME A/LCL Zoom
HO (Daily) TIME AR/LOG Zoom
HO (Daily) Combined A/LCL+AR/LOG TIME
________________________________________________________________________
Thursday’s MRI 3D Report was first published over 20 minutes before the Heating Oil OPEN 1700C/1800E/2300BRITISH/2400MEZ.
Specifically, as always, we recommended:
FLASH- BUY 1 HON 17 141.00 LMT/SELL 1 HON 140.24 STOP GTC (- risking 0.76 + slippage)
Will update with excellent TIME LOGIC asap.
_______________________________________________________________________
140.99 had been the session LOW so far. To be sure everyone could “catch the NORTH bound train” an UPDATE to BUY at MKT was posted as HON 17 was trading in the 141.40 area-with the same STOP GTC, of course.
UPDATE: IF you missed buying on the 141.00 LMT- BUY 1 HON MKT/140.24 STOP GTC
LOGIC IS STRONG! TIME: Yesterday was A/LCL 29(L)A= and A/LCL 58(N)A=,confirmed as the LOW CLOSE by today’s slightly higher close HON 17( 141.13) +0.03
________________________________________________________________________
I realize there are a lot of markets far sexier than HO! In fact, I’d guess of the MRI 3D futures markets we study: Gold (GC), Silver (SI), Dollar Index (DX), EURO (EU), WTI Crude (CL), Heating Oil (HO), ULTRA BOND (UB), Treasury Bond (US), 10 Year Note (TY) and the 3 commodities Cocoa (CC), Cotton (CT) and Soybean Oil (ZL) that good ol’ friendly HEAT is the least “attractive”. That strikes me funny some how because the popularity of a market, which is really just a “brand name” is of little to no importance. What IS important is the empirical clarity and quality of intention communication of the markets that selected themselves for the MRI 3D Report.
If you’ll carefully study the 5 charts you’ll probably agree HEAT can be quite the show off, when it feels like changing its “travel plans”.
In conclusion, even if this one trade proves to be decisively incorrect within less than 24 hours to Fridays close, we recommend accepting this TIME and PRICE, within DEPTH type of relative small risk to potential large gain trade that winning futures accounts demand and we work hard to deliver.
Witten and published by Stephen Cox, founder of MRI Trading Signals and developer of MRI 3D TIME PRICE analysis within DEPTH of 4 Chart Frames- 3 of them beyond the arithmetic bar chart finding > 70 % of signals invisible to everyone else.
Video Introduction - https://mritradingsignals.com/the-science-of-mri-3d/
MRI Trading Signals Home Page - https://mritradingsignals.com/
Stephen Cox
Stephen Cox is a 4 decade trader and analyst who first started teaching his TIME and PRICE methods in 1989. MRI 3D is the culmination of his work in Time, Price and the 3rd dimension DEPTH. The MRI Trading Signals Subscription is purely performance based. The only way we keep our fee is by delivering 6%+ return in our hypothetical account, during the 30 Days subscription.
© 2017 Copyright Stephen Cox - All Rights Reserved Disclaimer: This is an paid advertorial. The above is a matter of opinion provided for general information purposes only and is not intended as investment advice. Information and analysis above are derived from sources and utilising methods believed to be reliable, but we cannot accept responsibility for any losses you may incur as a result of this analysis. Individuals should consult with their personal financial advisors.
© 2005-2022 http://www.MarketOracle.co.uk - The Market Oracle is a FREE Daily Financial Markets Analysis & Forecasting online publication.