


The US Dollar Bull Case
Currencies / US Dollar Jun 15, 2017 - 03:09 PM GMT

 I see just about everyone has their own theory or trading discipline on where the US dollar is headed next. It’s all these different ideas that make the markets work. Everyone can’t be bullish at the bottom or bearish at the top, it’s just the way it has to be.
For my 2 cents worth I’m still looking at the possible fractal, bullish rising wedge as a halfway pattern to the upside. I did an in depth report on currencies and the US dollar several months ago in which I showed how it could play out. Since that report the US dollar has declined down to the point, where if the fractal is going to work, now is the time for the US dollar to put in its bottom.
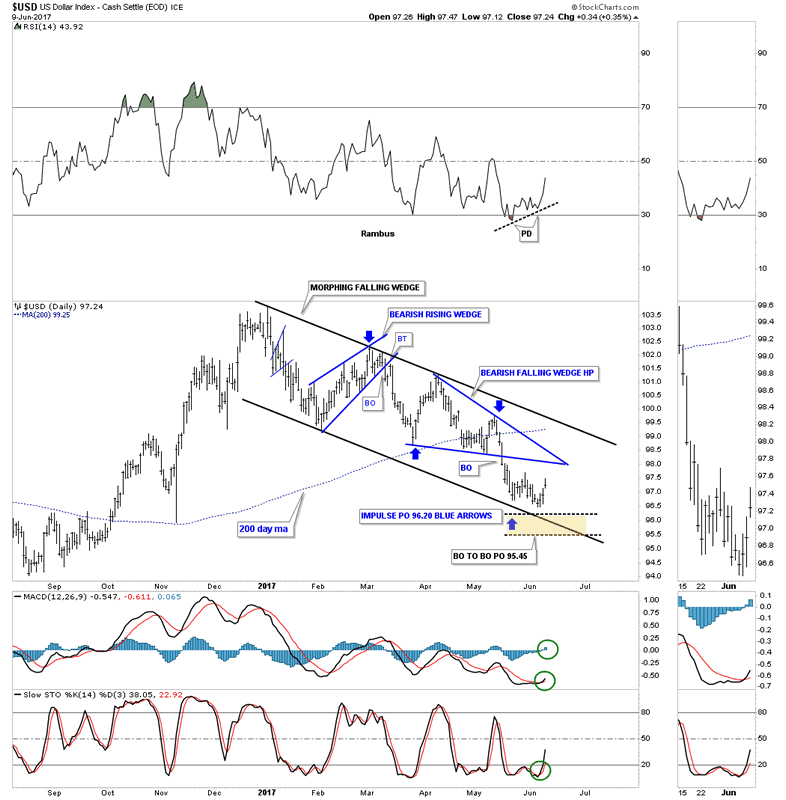
If you recall earlier this year the US dollar began building out a falling wedge while gold was building out a rising wedge. At the time I thought the US dollar would breakout topside and gold would breakout to the downside, but the markets never make it easy for you. A month or so ago when it became apparent that the US dollar was breaking down, I posted this daily chart looking for a measured move down to the 96.20 using the impulse method as shown by the blue arrows. The breakout to breakout method was a little lower at 95.45. So far the US dollar has reached a low of 96.45 were it has been chopping sideways for the last 2 weeks. If this is going to be an important low then we will most likely see some type of reversal pattern building out such as a double bottom or H&S bottom. So far we don’t have a recognizable reversal pattern in place. All the indicators are suggesting a potential low in here, but I want to see a reversal pattern before I get too excited.
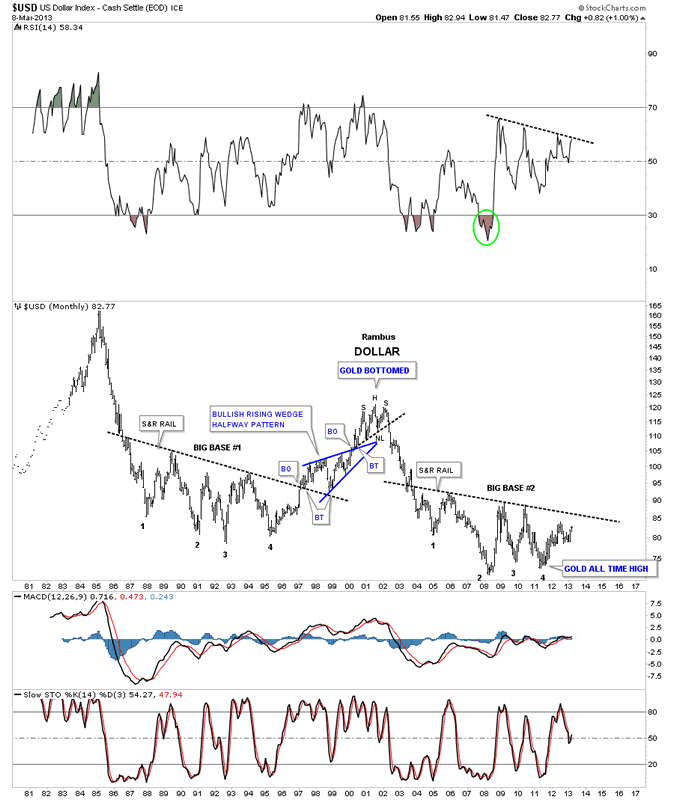
It was this 35 year monthly chart for the US dollar which led to to the discovery of the 2 fractal bases labeled big base #1 and big base #2 back in March 2013.
Editor’s Note: If you are interested here is the Whole Post from March 2013 ” Dollar Bears Prepare to Hibernate”
…………………………………………..
If I remember correctly it took close to a year after I discover these potential fractals before they came to fruition and vindication on my part. Seeing a large pattern like that building out well before its completion sews a lot of seeds of doubt. The vertical move out of fractal base #2 left no doubt that what I had been seeing a year earlier was in fact correct.
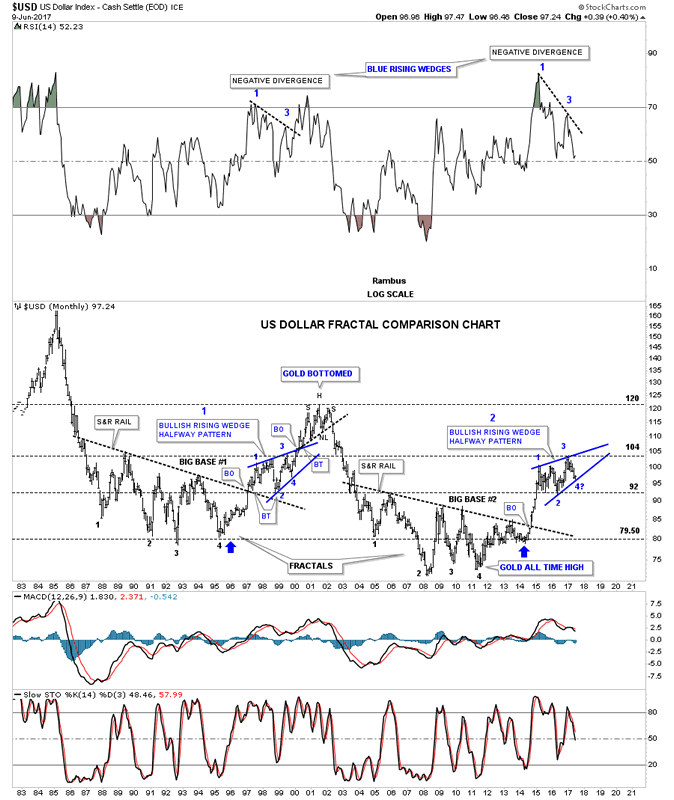
There is a lot of information on this chart so lets start by looking the two blue arrows which shows the first impulse leg up into the first reversal point in the blue bullish rising wedges in big base #1 and big base #2 which were exactly the same length. Reversal point #2 in both blue rising wedge found support at 92, thin horizontal black dashed line. From reversal point #2 they both rallied up to reversal point #3 at 104 which is the top for each blue rising wedge.
We are now at the most critical spot on the blue rising wedge fractal which is reversal point #4 and why the measured move down to 96.20, on the daily chart above, is so important. If the price action doesn’t hold around the 96.20 area and drops lower, then the bottom rail of the blue rising wedge won’t have the slope needed to have a rising wedge. The lower the price goes the lower the angle of the bottom rail. The top rail of both blue rising wedges are the exact same angle, but rising wedge #2 needs to bottom right here to be close to the same angle of rising wedge #1.
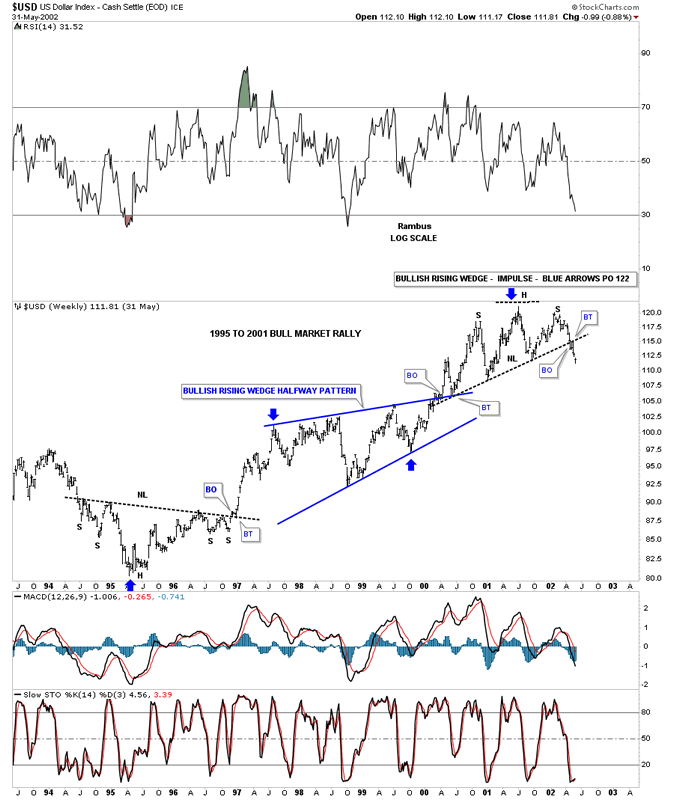
This next chart is a weekly look at the 1995 to 2001 bull market rally in the US dollar with the blue bullish rising wedge being the halfway pattern. The price objective was up to the 122 area as measured by the blue arrows. You can also see a H&S reversal pattern that began that massive rally and one to end the rally.
This last chart for the US dollar shows our current impulse leg up using the still incomplete bullish rising wedge as a halfway pattern. If the fractal is going to play out the 4th reversal point will need to hold support. Blue fractal #1 took 32 months to build out so if our current fractal is close in time we should see a breakout in October of this year which has a price objective up to 122 as shown by the blue arrows.
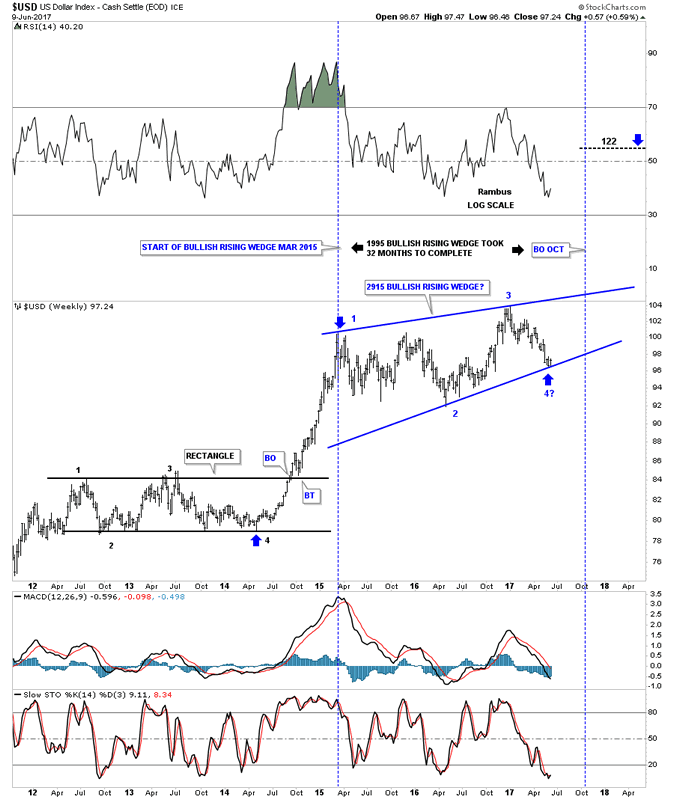
As I’ve stated many times in the past, when a fractal works it can be very rewarding, but a lot of the time they can fail at the last minute and everything comes to an abrupt end. This is where we’re at right now at reversal point #4.
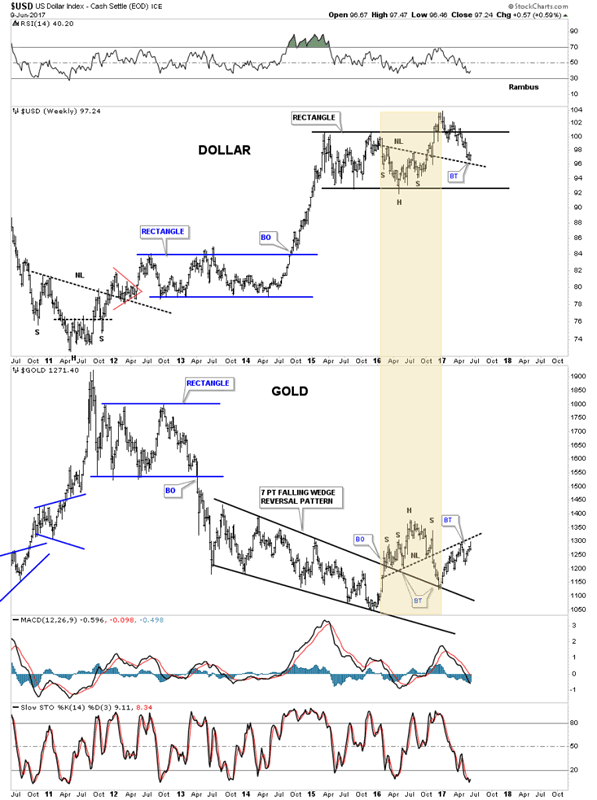
This last chart is a combo chart which has the US dollar on top gold on the bottom. The moment of truth has arrived. All the best…Rambus
All the best
Rambus
© 2017 Copyright Rambus- All Rights Reserved
Disclaimer: The above is a matter of opinion provided for general information purposes only and is not intended as investment advice. Information and analysis above are derived from sources and utilising methods believed to be reliable, but we cannot accept responsibility for any losses you may incur as a result of this analysis. Individuals should consult with their personal financial advisors.
© 2005-2022 http://www.MarketOracle.co.uk - The Market Oracle is a FREE Daily Financial Markets Analysis & Forecasting online publication.