


Charts That Explain Why The US Rule Oil Prices Not OPEC
Commodities / Crude Oil Jun 15, 2017 - 06:59 AM GMTBy: John_Mauldin

 BY GEORGE FRIEDMAN AND JACOB L. SHAPIRO : There’s no end in sight to slumping oil prices. That’s good news for consumers, but a dire trend for major oil producers like Saudi Arabia and Russia. And now, rising US oil production and exports are contributing to the slump.
Last week, oil prices reached new lows for 2017, with Brent crude dipping below $48 per barrel and West Texas Intermediate dipping below $46. The drop has been attributed to an unexpected increase in US crude inventories.
Not only that, the US is raising oil exports since the US lifted a 40-year ban on these exports in 2015. This led to modest increases in oil exports in 2016, but high increases so far in 2017.
This is a key reason prices will remain low in the long term.
Why the US Exports More
It is worth remembering why the United States banned oil exports in 1975 (exceptions were allowed at the discretion of the president).
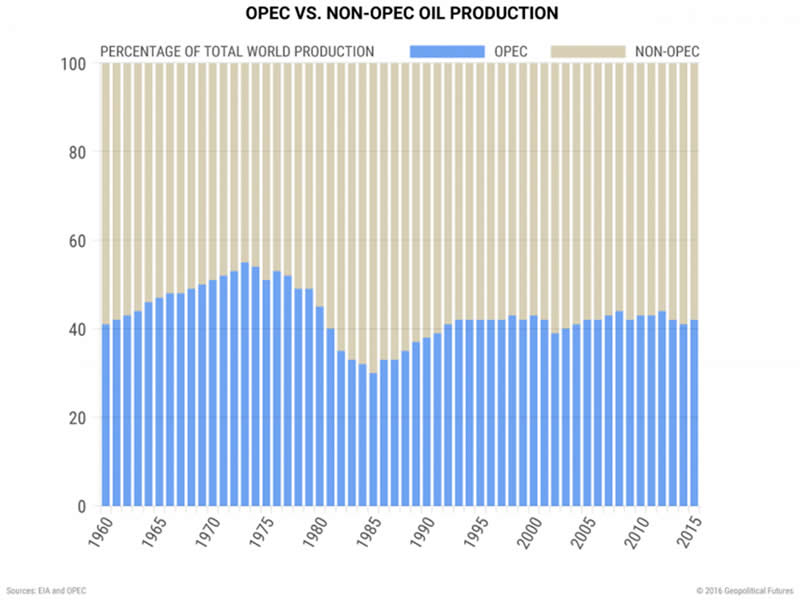
1970 set a record for the highest crude oil production in the US. The US was producing a lot, but it was also consuming a lot. That forced it to import more from OPEC states, which produced about 55% of the world’s oil in 1973.
This meant that OPEC could essentially control prices.
And after the US backed Israel in the 1973 Yom Kippur War, OPEC responded by raising oil prices. This created a fourfold jump in prices and a global oil shock.
One of the many ways the US responded was the 1975 Energy Policy and Conservation Act. This was designed to decrease its reliance on imports by banning oil exports. This would ensure US-produced oil is for domestic use only.
Fast-forward to today, and supply is no longer as big a concern.
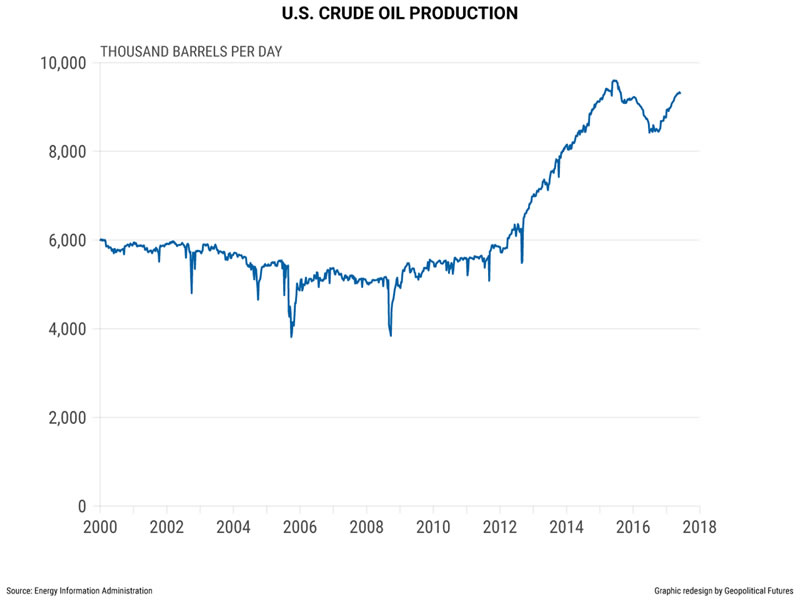
The US has weaned itself off foreign oil, partly through technologies like hydraulic fracturing and horizontal drilling. In 2013, the US started producing more oil than it imported, and it hasn’t looked back.
US crude oil production has almost doubled since 2010 and is already exceeding forecasts for 2017.
But it’s not just the US production numbers that are making waves: It’s the spike in US crude oil exports.
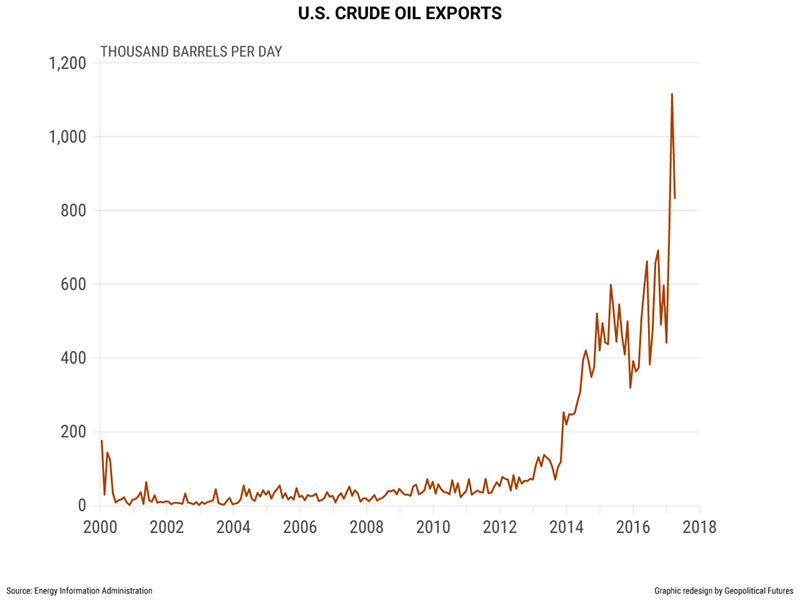
The US exported 830,000 barrels of crude per day in March, a whopping 64.2% increase year over year.
In February, it exported 1.1 million barrels per day, a nearly 200% increase year over year. The February numbers are closer to the new norm, as the WSJ expects the US to export, on average, roughly 1 million barrels per day in 2017.
A Disaster for Saudi Arabia and Russia
This is a huge challenge for major oil producers, especially Saudi Arabia and Russia.
In December 2016, OPEC and its oil partners agreed to cut production by about 1.8 million barrels per day, or roughly 1.5% of global crude production at the time.
OPEC, led by the Saudis, has largely made good on this pledge. The Russians have played with the numbers cutting production relative to December 2016 levels but not in year-over-year terms.
The OPEC deal managed to stabilize oil prices around $50 per barrel. And last month, the cuts were extended for another nine months. If it were still 1973, that might have caused a jump in oil prices.
But in 2017, OPEC produces only about 40% of the global supply, and the US is among the top three producers in the world.
The price of Brent crude spiked to $54.15 per barrel after the cuts were extended, but has since dropped almost 12% and may continue to fall.
This means that even the combined forces of OPEC and non-OPEC producers can’t prop up oil prices. Unless they are willing to slash production more severely. It also means that there is enough oil on the market to satisfy demand, even when major producers limit their supply.
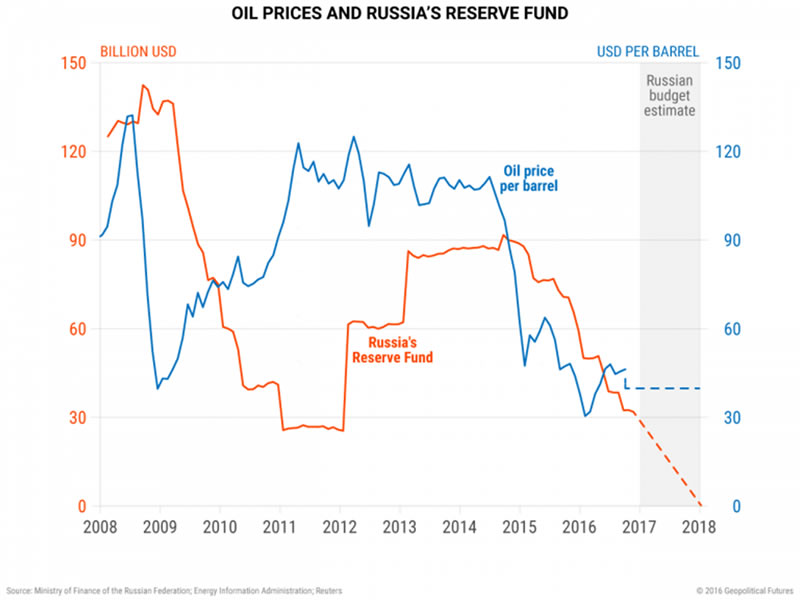
Maintaining prices at current levels is the best outcome these producers can hope for. However, this is a far cry from the price levels that Russia and Saudi Arabia need to stabilize their economies.
Yet Another Weapon in the US’ Arsenal
When we discuss US power in the world, we often trot out a few key points:
- The US economy accounts for just under a quarter of global gross domestic product;
- It has a military force without peer in the world;
- And its economy is not dependent on exports.
Now we can add one more point to this list: The US is the third-largest oil producer in the world; it is less dependent on oil imports than at any point in the last 40 years; and it is even stealing customers from Russia and Saudi Arabia with prices as low as $50 per barrel.
Even a few years ago, US shale producers would have found it hard to make a profit at that price, but they are succeeding at that now. Oil prices are going down, US oil exports are going up, and the effects will be global.
Grab George Friedman's Exclusive eBook, The World Explained in Maps
The World Explained in Maps reveals the panorama of geopolitical landscapes influencing today's governments and global financial systems. Don't miss this chance to prepare for the year ahead with the straight facts about every major country’s and region's current geopolitical climate. You won't find political rhetoric or media hype here.
The World Explained in Maps is an essential guide for every investor as 2017 takes shape. Get your copy now—free!
John Mauldin Archive |
© 2005-2022 http://www.MarketOracle.co.uk - The Market Oracle is a FREE Daily Financial Markets Analysis & Forecasting online publication.