


Will Crude Oil Stocks Breaks above Medium-term Resistance Line?
Commodities / Crude Oil May 12, 2017 - 05:43 PM GMTBy: Nadia_Simmons

 In recent weeks crude oil came back below the barrier of $50, which triggered declines and resulted in a drop to almost six-month lows. Despite this move, oil bulls pushed the commodity higher, which resulted in an invalidation of the breakdowns under important support levels. What happened at the same time with oil stocks? Will we see higher values of the XOI in the coming weeks?
Let’s jump right into charts (chart courtesy of http://stockcharts.com) and find out what can we infer from them about future moves.
Let’s start today’s article with the long-term chart of oil stocks.
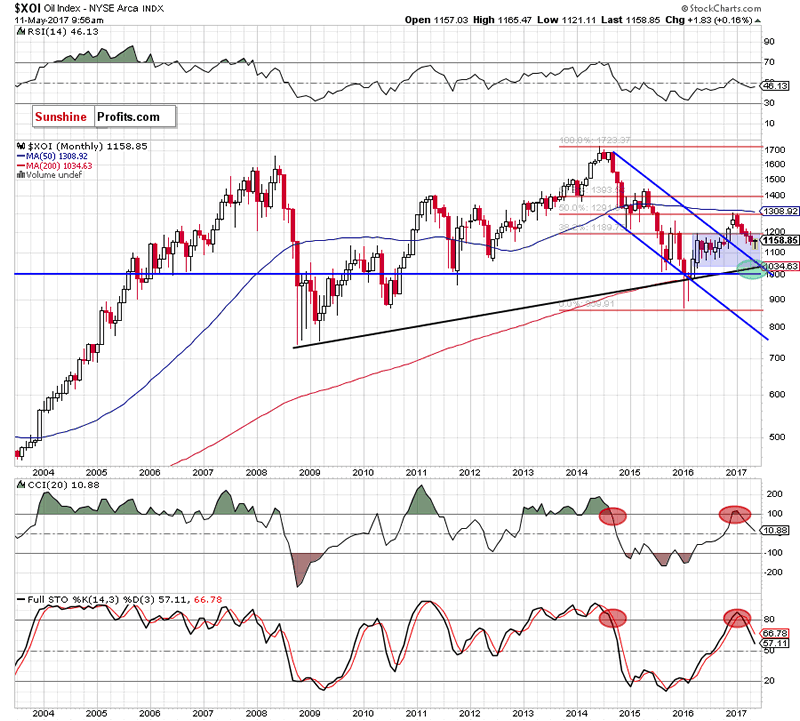
Looking at the long-term chart, we see that the overall situation hasn’t changed much as oil stocks are still trading slightly below the previously-broken upper border of the blue consolidation. Additionally, the sell signals generated by the CCI and the Stochastic Oscillator remain in place, suggesting another attempt to move lower.
But will we see such price action in the coming weeks? Let’s examine the medium-term chart and find out.
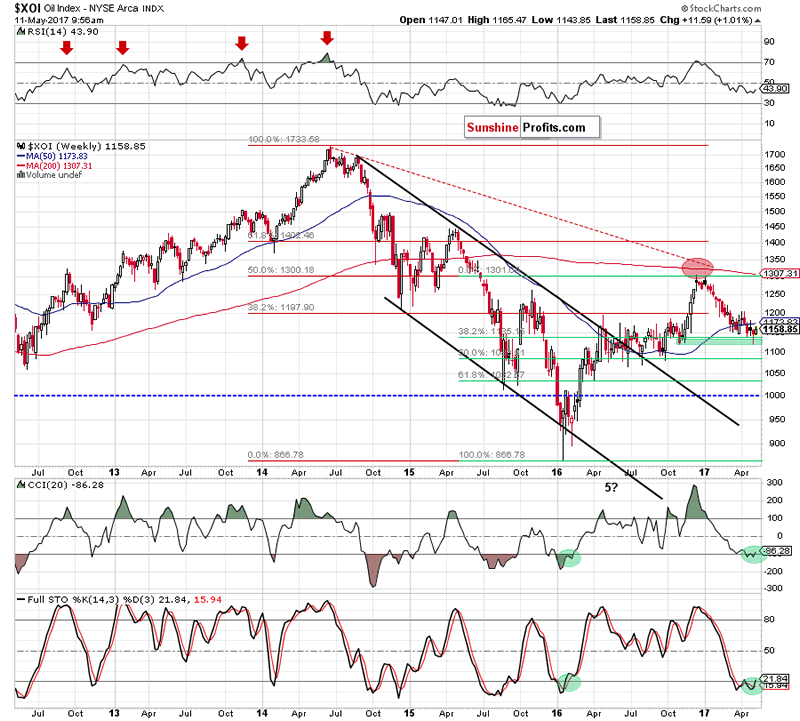
From this perspective, we see that the XOI moved a bit lower in the previous weeks, which resulted in a drop to the green support zone created by the October and November lows. As you see, this area triggered a rebound, which took oil stocks above the previously-broken 38.2% Fibonacci retracement. In this way, the index invalidated the earlier breakdown, which together with the current position of the indicators (the CCI and the Stochastic Oscillator generated buy signals) suggests further improvement in the coming weeks.
How high could oil stocks go? Let’s take a closer look at the daily chart.
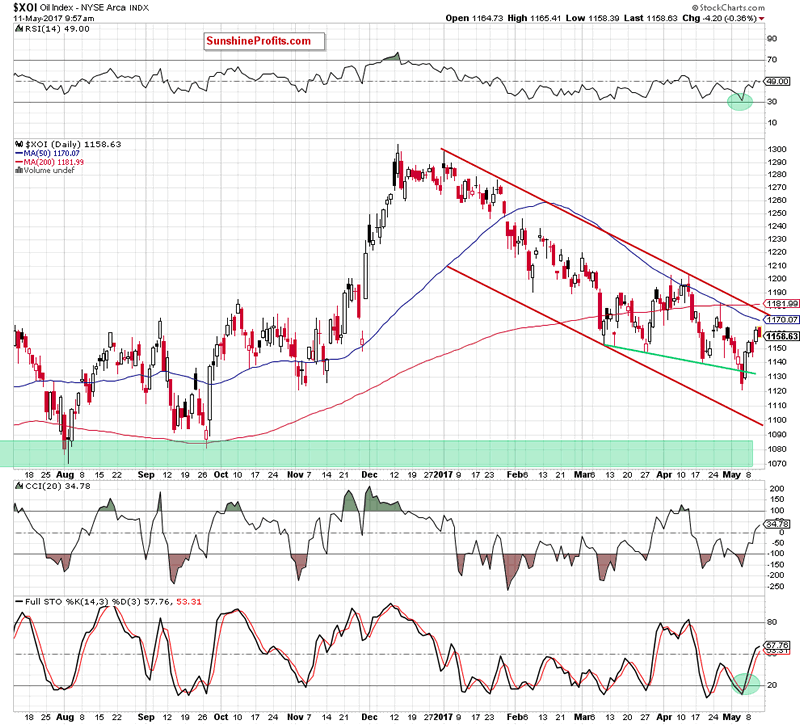
On the daily chart, we see that oil stocks rebounded in the previous week, invalidating the earlier small breakdown under the green support line based on the previous lows. Additionally, all indicators supported oil bulls generating buy signals. Taking all the above into account, we think that oil stocks will extend gains and the initial upside target will be around 1,176, where the upper border of the red declining trend channel currently is.
Summing up, the short-term outlook for oil stocks is currently bullish as the XOI invalidated the earlier breakdown under the green support line based on the previous lows. Additionally, oil stocks bounced off the green support zone (seen on the weekly chart), which together with the buy signals generated by the daily and weekly indicators suggest further improvement in the coming week(s). If you would like to know more about the oil market and interesting ratios, we encourage you to subscribe for Oil Investment Updates, Oil Trading Alerts or the All-Inclusive Package that includes them. If you’re not ready to subscribe now, please sign up for our free mailing list – you’ll receive notifications about our free analysis of crude oil, gold and other markets and you’ll get a ton of extras as a starting bonus. Sign up today.
Thank you.
Nadia Simmons
Forex & Oil Trading Strategist
Sunshine Profits: Gold & Silver, Forex, Bitcoin, Crude Oil & Stocks
Stay updated: sign up for our free mailing list today
* * * * *
Disclaimer
All essays, research and information found above represent analyses and opinions of Nadia Simmons and Sunshine Profits' associates only. As such, it may prove wrong and be a subject to change without notice. Opinions and analyses were based on data available to authors of respective essays at the time of writing. Although the information provided above is based on careful research and sources that are believed to be accurate, Nadia Simmons and his associates do not guarantee the accuracy or thoroughness of the data or information reported. The opinions published above are neither an offer nor a recommendation to purchase or sell any securities. Nadia Simmons is not a Registered Securities Advisor. By reading Nadia Simmons’ reports you fully agree that he will not be held responsible or liable for any decisions you make regarding any information provided in these reports. Investing, trading and speculation in any financial markets may involve high risk of loss. Nadia Simmons, Sunshine Profits' employees and affiliates as well as members of their families may have a short or long position in any securities, including those mentioned in any of the reports or essays, and may make additional purchases and/or sales of those securities without notice.
© 2005-2022 http://www.MarketOracle.co.uk - The Market Oracle is a FREE Daily Financial Markets Analysis & Forecasting online publication.