


Freeport McMoRan (FCX) Outlook Turning Bullish
Companies / Company Chart Analysis May 02, 2017 - 08:40 AM GMT

 Freeport McMoRan Incorporation (NYSE: FCX) is the world’s largest publicly traded copper and molybdenum producer and it’s also a major producer of gold but almost 70% of revenues are from the sale of copper. The Phoenix, Arizona-based companyis primarily engaged in mineral exploration and development, mining and milling of copper, gold, molybdenum and silver, as well as the smelting and refining of copper concentrates.
In the recent 2 months, Freeport’s shares dropped 27% as it had interrupted the production in Grasberg mine which is the largest gold mine and the third largest copper mine in the world because of a regulatory restrictions in Indonesia on its copper concentrate exports. However, the company recently announced that the matter was resolved as it’s looking to protect and support its past & long-term investment plans in Indonesia and it’s now resuming exports of copper concentrate from. The recent actions helped its stock to bounce, but the move is still weak so let’s take a look a the technical picture using Elliott Wave Theory.
FCX Elliott Wave View
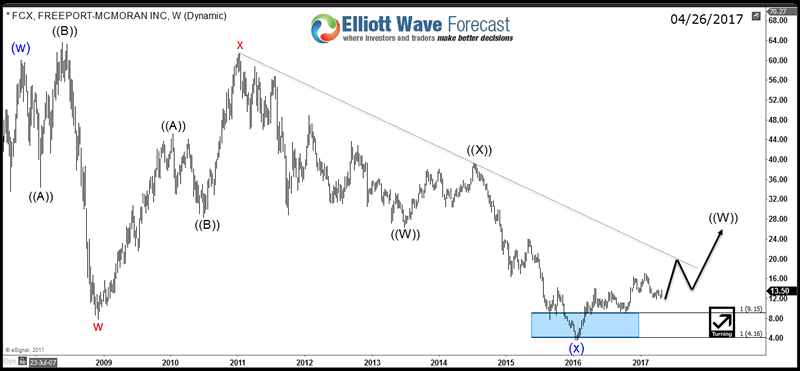
Weekly Chart: FCX did a double three structure from both 2007 & 2011 peaks and managed to reach both equal legs target at $9.15 & $4.16 with 7 swings already in place before finding a bottom early last year. Since then the stock managed to rally and it both cycles from the peaks already ended even the price level still didn’t break above the descending trend-line . Consequently the sentiment for the stock is turning bullish and it should be looking for a bigger 3 waves correction toward the 50% area around $32.
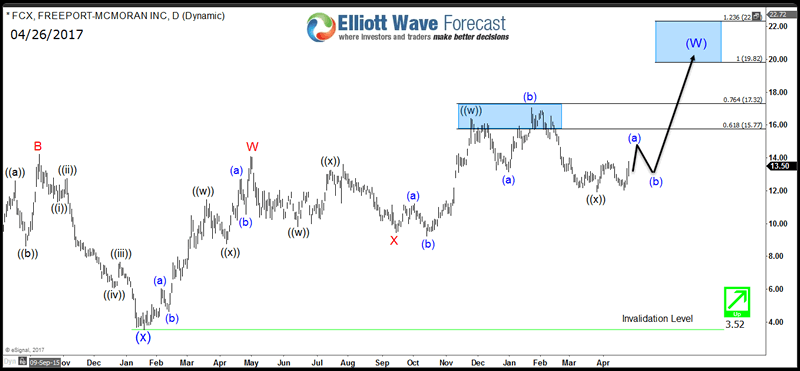
Daily Chart: The stock is showing 5 swing bullish sequence from January 2016 low and will remain supported as long as October 2016 low keeps holding. Currently it ended a flat correction in wave ((X)) and would ideally resume the move to the upside looking for a target at equal legs area 19.82 – 22.24 to end 7 swings sequence around the weekly trend-line and start a 3 waves pullback.
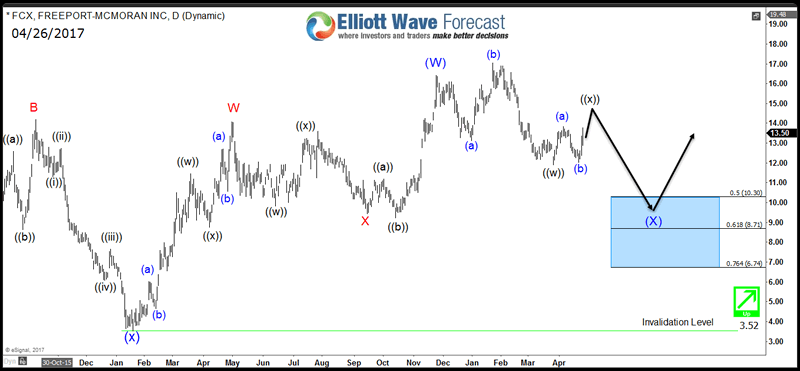
The short term turn around for FCX would happen if the stock has already ended the cycle from January 2016 low, in that case it will be only doing 3 waves bounce against the peak before another leg lower take place toward the 50%-61.8% Fibonacci area around $10.3 – $8.71 then the stock find buyers again as long as pivot at 3.52 is holding.
Recap:
The mining giant Freeport McMoRan is in a good financial shape despite the Grasberg mine issue in Indonesia and the technical outlook for its stock is turning to the upside as long as the 2016 low at $3.52 keeps holding. This means unless the company go bankrupt then no matter what path it will take in the near term, it will end up bouncing to higher level around $20 at first stage either from current levels or from $10 area then it will be looking to extend toward $33 later on.
For further information on how to trade forex, indices, commodities and stocks using Elliott Wave theory , take this opportunity and Try our services 14 days for FREE . You will get access to our 52 instruments updated in 4 different time frames, Live Trading Room and 2 Live Analysis Session done by our Expert Analysts every day, 24 hour chat room support and much more.
By Ayoub Ben Rejeb
https://elliottwave-forecast.com
ElliottWave-Forecast has built its reputation on accurate technical analysis and a winning attitude. By successfully incorporating the Elliott Wave Theory with Market Correlation, Cycles, Proprietary Pivot System, we provide precise forecasts with up-to-date analysis for 52 instruments including Forex majors & crosses, Commodities and a number of Equity Indices from around the World. Our clients also have immediate access to our proprietary Actionable Trade Setups, Market Overview, 1 Hour, 4 Hour, Daily & Weekly Wave Counts. Weekend Webinar, Live Screen Sharing Sessions, Daily Technical Videos, Elliott Wave Setup .
Copyright © 2017 ElliottWave-Forecast - All Rights Reserved Disclaimer: The above is a matter of opinion provided for general information purposes only and is not intended as investment advice. Information and analysis above are derived from sources and utilising methods believed to be reliable, but we cannot accept responsibility for any losses you may incur as a result of this analysis. Individuals should consult with their personal financial advisors.
© 2005-2022 http://www.MarketOracle.co.uk - The Market Oracle is a FREE Daily Financial Markets Analysis & Forecasting online publication.