


Tadawul All Share Index (TASI) Overall Bullish Characteristics Remain
Stock-Markets / Emerging Markets Apr 03, 2017 - 01:13 PM GMTBy: MarketsToday

Following a breakout from a relatively large Double Bottom trend reversal pattern in late-November (breakout above 6,875.69) of last year the Tadawul All Share Index (TASI) pulled back and has been consolidating around support near the top of the Double Bottom and the 200-day exponential moving average (ema).
Price was rejected at the 200-day ema with a low of 6,709.90 four weeks ago as it held as support. So far that’s the low for the retracement that began off the 7,290.33 peak hit in the beginning of January. The TASI broke out above the 200-day ema back in November.
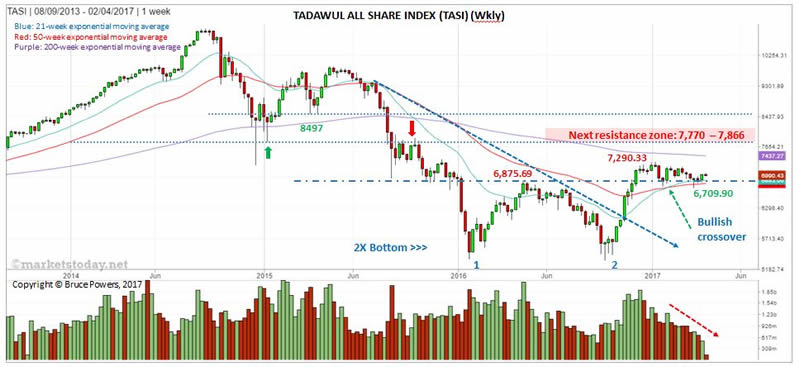
The retracement off that peak has developed with relatively low volatility and has been shallow so far. A decline of as much as 8.0% occurred off the peak at the recent low and the retracement of the prior uptrend (off the October 5,327.49 low) has been less than one-third. Such a shallow retracement is a sign of strength if that’s the end of it. Another sign of long-term strength is that in January the 21-week ema crossed above the 55-week. Also notice that volume has been dropping as the consolidation pattern develops.
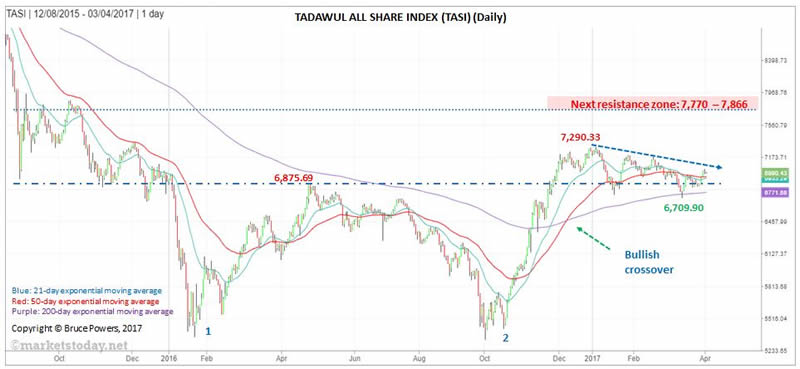
A decisive breakout above the downtrend line coming off the January peak will give the first sign of strength that may lead to further upside. Confirmation of strength then occurs on a daily close above 7,192.63. If that is followed by a daily close above the 7,290.33 peak then a bullish trend continuation signal is given.
Following a breakout above the January high the TASI would first be targeting a potential resistance zone from approximately 7,770 to 7,866. That price zone consists of prior support and resistance levels plus the 127.2% Fibonacci extension of the current decline at 7,824.22.
Watch the 200-day ema (now at 6,771.68) and the recent low of 6,709.90 for key support as a drop below there will likely lead to further selling. (www.marketstoday.net/en/)
Bruce Powers, CMT
Chief Technical Analyst
http://www.marketstoday.net/
© 2017 Copyright Bruce Powers- All Rights Reserved
Disclaimer: The above is a matter of opinion provided for general information purposes only and is not intended as investment advice. Information and analysis above are derived from sources and utilising methods believed to be reliable, but we cannot accept responsibility for any losses you may incur as a result of this analysis. Individuals should consult with their personal financial advisors.
© 2005-2022 http://www.MarketOracle.co.uk - The Market Oracle is a FREE Daily Financial Markets Analysis & Forecasting online publication.