


USD and Gold: Intermediate and Super Cycle Update
Currencies / US Dollar Apr 03, 2017 - 05:12 AM GMTBy: SurfCity

 Beyond the 5-6 month Intermediate Cycle and Yearly Cycle (2-3 Intermediate Cycle), there are also longer Cycles for all assets. Gold for example has a 4 Year Cycle and the USD has a 3 Year Cycle (measured Low to Low). The USD also has a 15 Year Super Cycle (5 of its 3 Year Cycles).
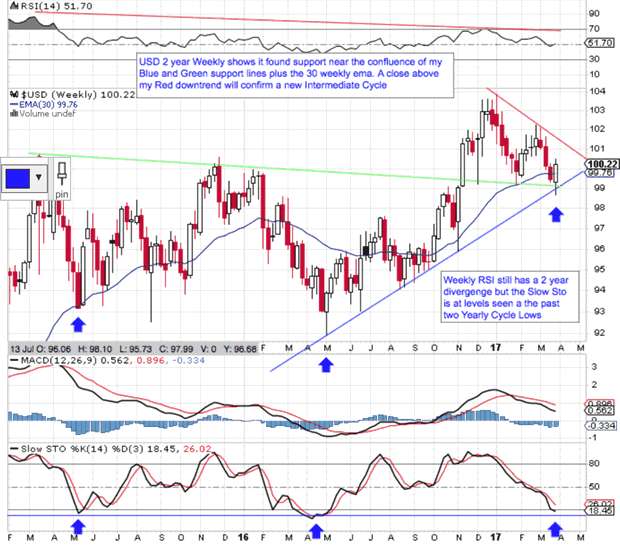
I have stated that my longer term Cycle analysis indicates the USD should be making its 15 Year Super Cycle top in 2017 but I am not sure just yet if this is behind us or dead ahead. As always, the Price and Time action on the charts will guide me. For now the Wedge in my first chart needs to be watched closely over the next couple of weeks. A break to the upside of my Red down trend line will confirm a new Intermediate Cycle for the USD while a more serious breach of my Blue Uptrend line that goes all the way back to early 2014 would have me strongly consider that the 15 year top is in.
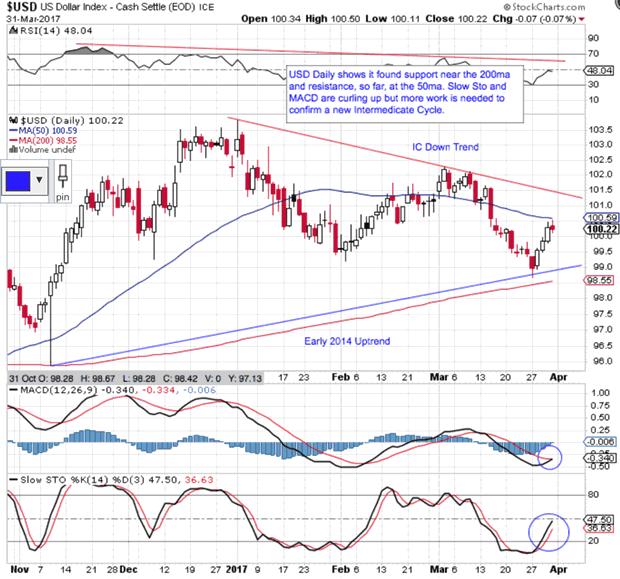
My first charts on the USD shows it most likely made an Intermediate Low at the confluence of my Blue and Green lines near the 30eam. Price is now back above the 30ema on the weekly and this long term moving average is sloping up and providing support at Major Lows. If you are a Gold Bull, take notice as this still indicates the USD is still in a Stage 2 Bull Market. This may not be what you want to hear but I don't sugar coat things with my analysis. I tell it like it is using Weinsteins 4 Stage concepts (see the post on the sidebar for reference). We still have a long term divergence on the weekly USD RSI levels which supports the longer cycles may be topping but the Slow Sto on the Weekly also hit levels seen at the last 2 Yearly Cycle Lows for the USD. My 2nd chart shows the USD is at resistance near the 50ma so we may see some consolidation next week that allows Gold to move higher. Time will Tell.
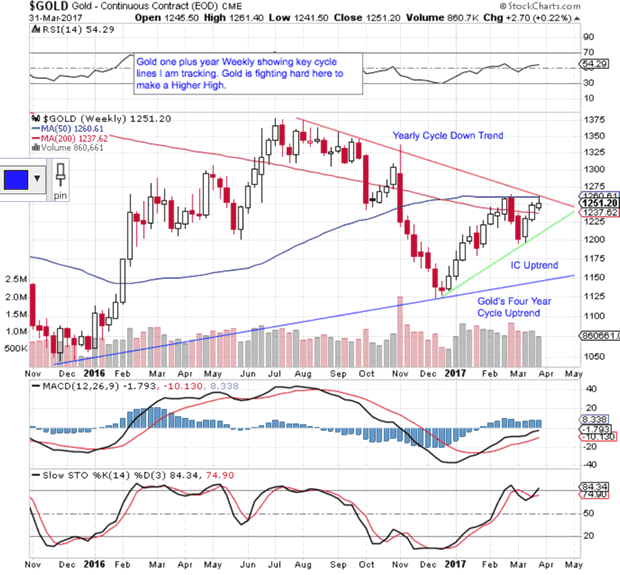
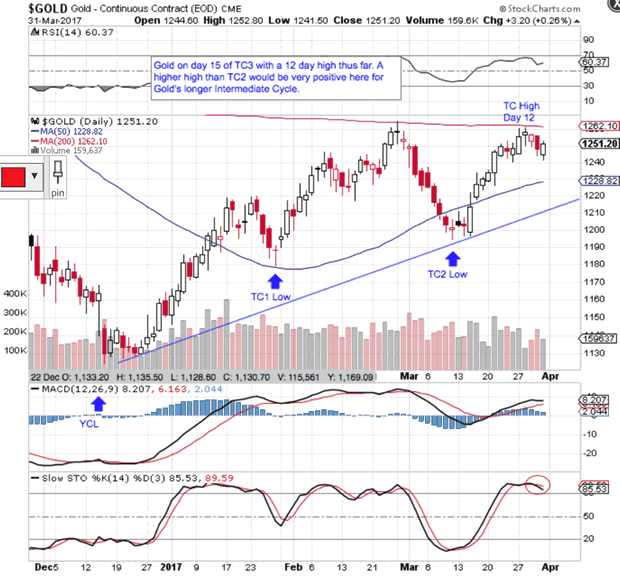
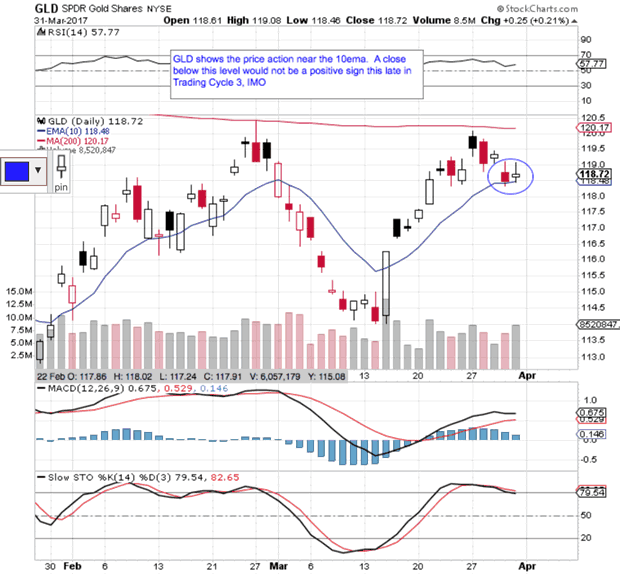
My first Gold chart shows you Gold's current Blue 4 Year Cycle Uptrend that I am tracking, plus the Green Intermediate Uptrend. My 2nd chart provides a close up of Gold's current Intermediate Cycle. If Gold can find support at the 10ema this would likely establish a half cycle low here and allow Gold to make a higher TC3 high this week which is higher than the TC2 high this would be very positive for the longer Intermediate Cycle, IMO. The last chart on GLD shows how the 10ema on the Daily will be critical to watch for daily closes. Stockcharts timing for EOD price prints on Gold is an issue for me so I will rely on GLD.
By Surf City
Everything about Cycle Investing
© 2017 Surf City - All Rights Reserved
Disclaimer: The above is a matter of opinion provided for general information purposes only and is not intended as investment advice. Information and analysis above are derived from sources and utilising methods believed to be reliable, but we cannot accept responsibility for any losses you may incur as a result of this analysis. Individuals should consult with their personal financial advisors.
© 2005-2022 http://www.MarketOracle.co.uk - The Market Oracle is a FREE Daily Financial Markets Analysis & Forecasting online publication.