


Time to Repair the Deflating US Dollar
Currencies / US Dollar Apr 02, 2017 - 05:03 PM GMTBy: Tony_Caldaro

 Every century the US has been existence there has been a new USD. And we believe it is time for a new US Dollar in the 21st century. In the following paragraphs we hope to explain why this is required, and how this could be accomplished in the coming years. First a little history.
In the 18th century (1792) the US established the first USD with the one ounce Silver coin. There was no paper currency only Silver and Gold coins. The US was on a Silver standard, and one ounce of Silver was worth $1.
Forty years later in the 19th century (1832) the US officially went on a Gold standard. One ounce Gold coins were produced at a face value of $20 each, and the one ounce Silver coins retained their $1 valuation. Paper currencies sprung up from time to time, but they all eventually became worthless.
In the 20th century (1900) the US produced its first official paper currency. These paper $20 dollar bills were backed 100% by Gold, and were termed Gold Certificates. There were also Silver certificates that were obviously priced at the lesser value. $20 Gold coins and $1 Silver coins continued to be produced as well. The Gold certificates were completely redeemable into Gold at any bank. In 1933 FDR called for a bank holiday, called in all the Gold in the country, made it illegal for Americans to own Gold, and raised the benchmark price of Gold from $20 to $35. Gold certificates were now a thing of the past, and the Treasury started producing Federal Reserve Notes. Then in 1971 Nixon took the USD completely off the Gold standard, and it was legal for Americans to own Gold again.
In summary. A Silver coin standard in 1792. A Gold coin standard in 1832. Paper Gold/Silver Certificates in 1900. Then Federal Reserve notes in 1933. This is where it stands now. Each century a new US Dollar. So why do we need a new US Dollar?
Just after the forming of the US the industrial revolution began. Prior to that the colonies were 100% agricultural. In the decades that followed, manufacturing and transportation of goods started to play a larger and larger role in the economy. What agriculture and manufacturing have in common is that they are both dependent on commodity prices. Raw materials for the manufacturing of goods; and supply/demand of foods, grains, cotton, and tobacco. The economy was commodity driven.
When the economy grew, it was because demand was rising and this was inflationary. When the economy contracted, it was because demand was declining and this was deflationary. It other words the economy was not as we know it today: expansion and contraction. It was inflation and deflation. Nearly every expansion was inflationary/growth, and nearly every contraction a deflationary/depression.
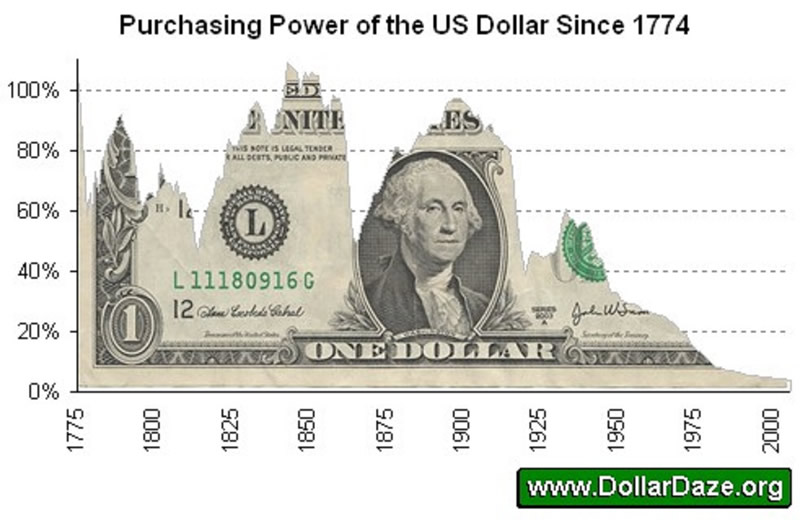
The purchasing power of the USD, with a fixed asset priced behind it, quite naturally declined during inflationary periods, and rose during deflationary periods. With prices rising items cost more. With prices declining items cost less. In an expansion/depression economy, inflation/deflation was somewhat self-correcting for the purchasing power of the USD as noted in the chart above. This all ended with the last, and great, depression of the 1930’s.
At the turn of the 20th century the consumer started to play a bigger role in the economy. Especially when consumer credit was introduced in the 1920’s. When the economy started to contract in 1930, the Government just let it unfold as it had many times before over the previous 100+ years. Inflationary periods were always self-corrected by deflationary periods. Or so they thought. The consumer-driven bubble created in the late-1920’s pre-staged the largest crash/depression in US history. The consumer was becoming a larger part of the economy, and not many realized the impact that would have in the decades to come.
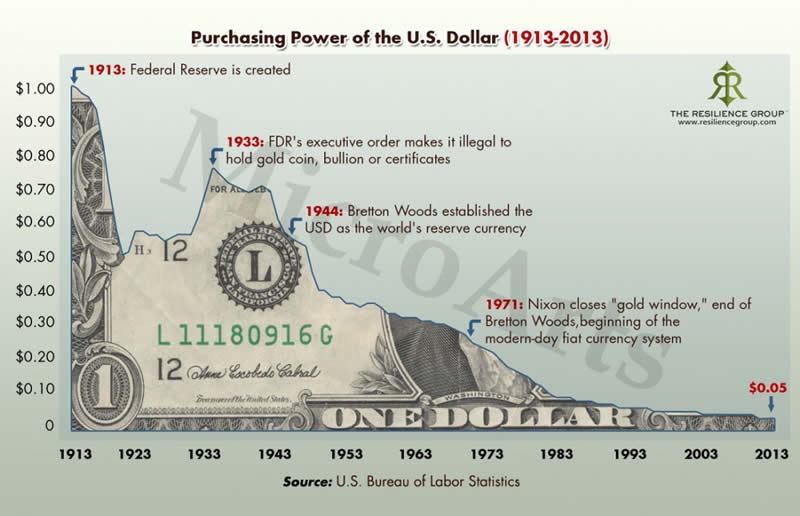
For the 100-year period between 1913 and 2013 the US Dollar lost 95% of its purchasing power. The self-correcting inflation/deflation cycles of the purchasing power of the USD ended when the government intervened in 1933. Not that intervention is a bad thing. It is not! However, government intervention and a growing consumer base led to a new problem. Devaluation of the purchasing power of the USD. What cost $1 in 1913 now costs over $20.
That is a drastic devaluation of purchasing power, and it has occurred in every country, to a greater/lesser degree, throughout the world. The reasons of course are price inflation and monetary inflation. Price inflation is unavoidable and occurs in 30-year cycles. Monetary inflation is the 2% targeted inflation rate by the FED. This is to assist the US Government in having sufficient liquidity to cover the interest payments on the debt. The US Dollar has been a non-interest bearing debt instrument, created by debt, since 1971. More of them have to be created than debt, just to cover interest payments. This is monetary inflation.
Many have claimed returning to the Gold Standard would stabilize the purchasing power of the Dollar. This is not only impracticable, since there are over $14.7 trillion Dollars in circulation and only about $300 billion in Gold in the US Treasury. It also would not work, even with a partial backing in Gold, as will be explained.
The US was on a Gold standard for nearly 60 of the 100-year period on the chart posted above. During the first 7 years, 1913-1920, the US Dollar lost half of its purchasing power due to the commodity price inflation of WW I, which peaked in 1920. Purchasing power then recovered somewhat mainly due to deflation during the depression, until the government intervened. Then the commodity price inflation of WW II began in the early 1940’s. This commodity cycle peaked in 1951, and the US Dollar again lost about half of its value during that period. For the next 20 years there was a slight gradual decline until the next commodity bull market began around 1970. Again, over the 10-year commodity bull market the Dollar’s purchasing power collapsed even further. Keep in mind from 1913-1971 the US was on a Gold Standard, and Dollar purchasing power declined about 75% during that time. A Gold standard, even if it was possible today, is not the answer.
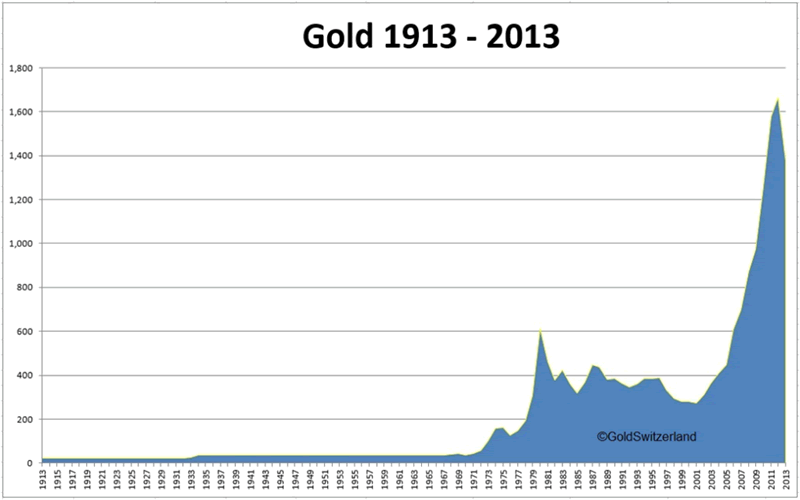
This chart is the annual price of Gold between 1913-2013. Notice during the entire time the US was on the Gold standard the price was fixed: $20.67/oz. until 1933, then $35.00/oz. until 1971. After that the price of Gold was freed to be traded in the open market. Notice the two explosive moves between 1970-1980 and 2001-2011. Both periods were due to commodity bull markets. Commodity bulls run for about 10 years, and start about every 30 years: 1910, 1940, 1970, 2000, 2030(?).
A potential remedy would have been to adjust the fixed price of Gold for inflation/deflation on an annual basis. With the US Dollar backed by Gold, and Gold rising in price during commodity bull markets, the USD would have somewhat maintained its purchasing power. There is, however, a problem with being on the Gold standard. Nearly every country in the world owns Gold. It is an international currency. During the 1930’s, for example, many countries sold their Gold to the US to raise USDs, to fight the depression in their country. This helped the US increase its money supply during the 1930’s, as more USDs had to be printed to pay for the Gold. And it helped in the recovery. But what if Gold is being sold to the US when there is no need to increase the money supply? Especially during inflationary periods. With the USD fully convertible into a single asset, that is readily available to any country in the world, it presents a potential problem.
It should be clear by now why the Gold standard failed to maintain purchasing power of the USD. The US government had to keep the Gold price fixed to control the outflow of US Dollars to foreign countries, that would sell Gold to the US. If the Gold price was allowed to float while on the Gold standard, huge amounts of Dollars would flow out of the US during commodity bull markets (rising Gold prices). This would have created hyper-inflation in the US, as too many USDs would be chasing a stable amount of goods. To avoid this the US government pegged the price of Gold to control the outflow. By keeping the Gold price pegged at the same price for decades at a time, and ignoring inflation, the US Dollar continued to lose its purchasing power over time. What is needed to maintain purchasing power, is a USD backed by US-centric assets. Not just international assets.
You are probably thinking by now that the USD has not been backed by anything since 1971, except with the full faith and trust in the US Government. For the most part this is absolutely true. For the most part. Starting in late 2008, and continuing into 2013, the FED used its Quantitative Easing programs to increase the monetary base. Their objective was to purchase AAA US debt from their Primary Dealers, and credit these Dealers accounts with US Dollars. This offered the Dealers, which are mostly banks and brokerage firms, an opportunity to increase liquidity and improve their balance sheets. Over the 5 year period the FED increased the monetary base from $800B to $4.2T. The Primary Dealers increased their excess reserves from $1.6B to $2.7T. The program was a huge success.
What many didn’t realize at the time was that these new USDs were not created by debt, as the US has done since 1971. These new Dollars, that were credited to the Dealers, were actually backed by debt. For every Dollar credited, the FED is holding one Dollar in Debt. These USDs are asset-back Dollars. The FED effectively created the first asset-backed USDs since 1971. When the FED begins to unwind their balance sheet, which is their plan, they will sell or hold to term the debt, credit their USD account from either the buyer or the issuer, and wipe out the USD debit they created when they purchased the debt. These asset-backed USDs will then disappear. The takeaway from this is that it is not that difficult to create asset-backed USDs.
To summarize thus far. Commodity bull markets occur about every 30-years and last for about 10 years. During this time the purchasing power of the USD is drastically reduced. A Gold standard did not work because, due to 100% convertibility, the Gold price had to be fixed to prevent undesired outflows/creation of USDs. Had the Gold price been allowed to fluctuate, without 100% convertibility, the USD would not have lost as much of its purchasing power. Gold alone is not the solution, because every country owns it and it is too volatile. A basket of assets would make convertibility a lot more difficult, than the simple USDs for Gold – Gold for USDs. Especially if the assets are more US-centric. The clear solution to the loss of purchasing power of the USD, is to back it with a basket of assets that appreciate over time.
A long-term solution could be to eventually back the USD with a combination of US Debt, the SPX index and Gold. The reason for this is three-fold. The combination of assets would make convertibility a lot more difficult. During low-inflationary periods, which last about 20 years, the SPX index generally trends higher while Interest rates and Gold enter/remain in a trading range. During high-inflationary periods, which last about 10 years, Interest rates and Gold generally trend higher while the SPX index enters/remains in a trading range. The result is a portion of the asset-backed basket is nearly always trending higher. And in the end, the purchasing power of the USD is appreciating, rather than depreciating over time. We have done the math, for the entire 100-year period, and it works.
With US total debt nearing $20T, the SPX index around $20T, and US Gold holdings valued around $300B, a combination of these assets could work. We considered the volatility of the price of Gold and the SPX over time, and the stability of US debt if held to term. The compounding effect of reinvested Debt interest payments to offset monetary inflation was also considered. After deciding on what percentages to use, we chose to use year-end prices to update the value of the assets on an annual basis. In real time this could be done on a quarterly basis. But for analytical purposes we simply used year-end prices. What we left out of the analysis was the compounding effect of SPX dividends. We then made the calculations from the year 1913 unto the end of 2016. The results were outstanding!
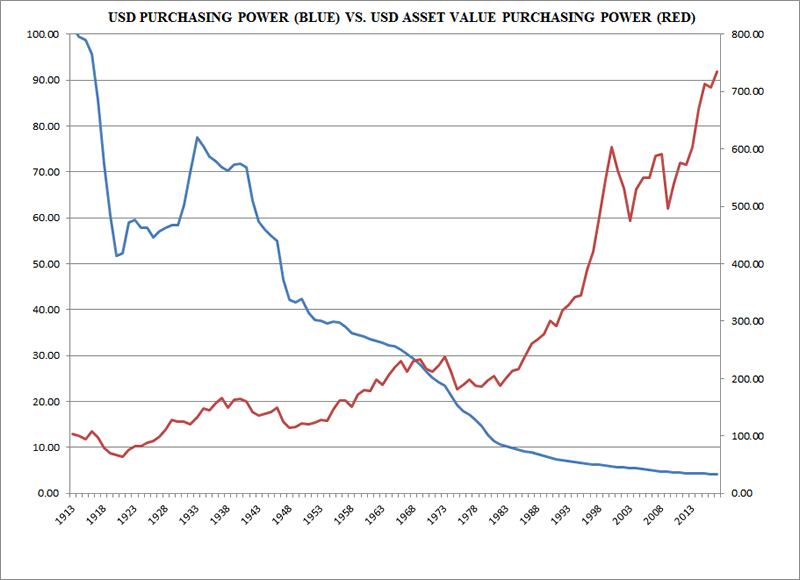
From 1913-2016 the purchasing power of the USD declined from $1.00 to 4.12 cents. The data: https://fred.stlouisfed.org/series/CUUR0000SA0R. This means it now costs $2427.18 to purchase the same item that would have cost $100.00 in 1913. If the USD had been backed by 60% Debt, 30% SPX and 10% Gold during the entire period of time. The purchasing power of the USD would have increased from $100.00 in 1913 to $730.59 in 2017. The USD would not have lost purchasing power, it would have gained it seven-fold.
When we added in an estimated 2.1% SPX reinvested dividend yield, historically the yield is more like 4%, the results were even better. As you can see, while the compounding effect of inflation can have a devastating impact on purchasing power. The compounding effect of interest, dividends and economic growth can provide a totally offsetting effect.
In 24 of the 104 years a decline in the SPX and/or Gold would have created a net negative effect on the assets backing the USD. Meaning the USD would have been worth less than the year before. Since most citizens would not like to see their savings go down in value, rather than remain the same, we started thinking about a simpler solution. Also, hardly anyone lives for 100+ years, and the compounding effect of interest on the debt would not be as dramatic in real time. Last, with the potential drawdowns this approach would be a hard sell to the public and politicians alike. But long-term it should work, and dramatically well! We have the data and the calculations on a spreadsheet, with formulas, for future reference.
An alternate approach would be to do exactly as the FED has done recently. That is to back the USD with US Government debt. We did the calculations from 1913-2016 year end, with simple interest, and it works fine. The interest paid on the debt beat inflation by over 3:1 during the entire period, and there were no drawdowns. All the debt is held to maturity, so there is no reason to mark-to-market. Might be an easier sell too. The first objective would be to eventually back every single USD with a Dollar of interest paying US Government Debt. And, the interest is paid to bank depositors quarterly/annually.
There is $19.98T in US Government debt, $14.72T in cash/cash-equivalent deposits (MZM money stock), and $1.53T in actual currency. Dealing with such large amounts, this could not be done overnight. It can be done, however, over a number of years. This is how.
Financial institutions can set up ABC (Asset-Backed Cash) accounts for the public. The public deposits money into these accounts just like a savings account. Since there is never any risk to the principle the public can deposit and withdraw at any time. Banks can also use these accounts as collateral just like savings accounts. Whenever the Treasury issues new debt, through an offering or refunding, the Banks sweep the unbacked cash in these accounts, provide the FED with the total amount, and the FED buys most or all of the Treasury offering. The funds that were swept are now asset-backed cash, and credited to the ABC accounts.
The Bank keeps track of the individual balances, just like they were paying interest on a savings account. Then quarterly they notify the FED of the total balance. The FED then pays the interest to the Bank to be divided up among its customer’s ABC accounts. The Banks can also pay their own interest on these accounts since they can be used for collateral on public loans. The public then would receive interest from the FED and the Bank. The interest from the Bank was not used in our calculations.
This process continues every Treasury offering, until all USDs are backed by US Government debt. The entire process could be as short as 5 years, or could take as long as 20 years. This depends on how the program is received by the public, and available debt. Eventually, every USD will be backed by US Debt. The immediate benefits would be huge.
With an asset-backed USD and an ongoing buyer of US Debt, interest rates would remain at their historically low range of 2% to 8%. Rather than spiking to double digits like they did in the 1970’s. Inflationary peaks would be somewhat subdued, like the early part of the 19th century as well. Bank deposits would likely to be significantly higher than they are now. The USD currency is also likely to be more stable over time, which would help business and the economy. In fact, most of the currencies of the world would eventually also move to asset backing. And, the loss of purchasing power of the USD will be a thing of the past. Inflation would still continue, but the purchasing power of the asset-backed USDs would clearly defeat its impact. The new USD would effectively end the ongoing loss in purchasing power at once and for all time.
CHARTS: http://stockcharts.com/public/1269446/tenpp
After about 40 years of investing in the markets one learns that the markets are constantly changing, not only in price, but in what drives the markets. In the 1960s, the Nifty Fifty were the leaders of the stock market. In the 1970s, stock selection using Technical Analysis was important, as the market stayed with a trading range for the entire decade. In the 1980s, the market finally broke out of it doldrums, as the DOW broke through 1100 in 1982, and launched the greatest bull market on record.
Sharing is an important aspect of a life. Over 100 people have joined our group, from all walks of life, covering twenty three countries across the globe. It's been the most fun I have ever had in the market. Sharing uncommon knowledge, with investors. In hope of aiding them in finding their financial independence.
Copyright © 2017 Tony Caldaro - All Rights Reserved Disclaimer: The above is a matter of opinion provided for general information purposes only and is not intended as investment advice. Information and analysis above are derived from sources and utilising methods believed to be reliable, but we cannot accept responsibility for any losses you may incur as a result of this analysis. Individuals should consult with their personal financial advisors.
Tony Caldaro Archive |
© 2005-2022 http://www.MarketOracle.co.uk - The Market Oracle is a FREE Daily Financial Markets Analysis & Forecasting online publication.