


Crude Oil Price Decline Continuation
Commodities / Crude Oil Mar 20, 2017 - 04:23 PM GMTBy: Bob_Loukas

 I like this Crude oil decline, and to date, it has been a picture perfect Cycle’s development. Members of The Financial Tap were already tracking that expectation in advance, and positioned well to take advantage. But that big decline, which started on March 7th took many by surprise, judging by the extreme (Long) positioning seen with the COT report. And if you were not already short before the move began, the speed of the decline made it nearly impossible to establish a new position thereafter.
I believe that might not be the case anymore and another opportunity is at hand. We’ve seen a clear Cycle Low (March 14th) in my opinion, and that was confirmed with the rally after the FOMC last week. I know it was only a three day rally, but the move back to the 10-day moving average is possibly all that we’re going to see, from a counter-trend perspective.
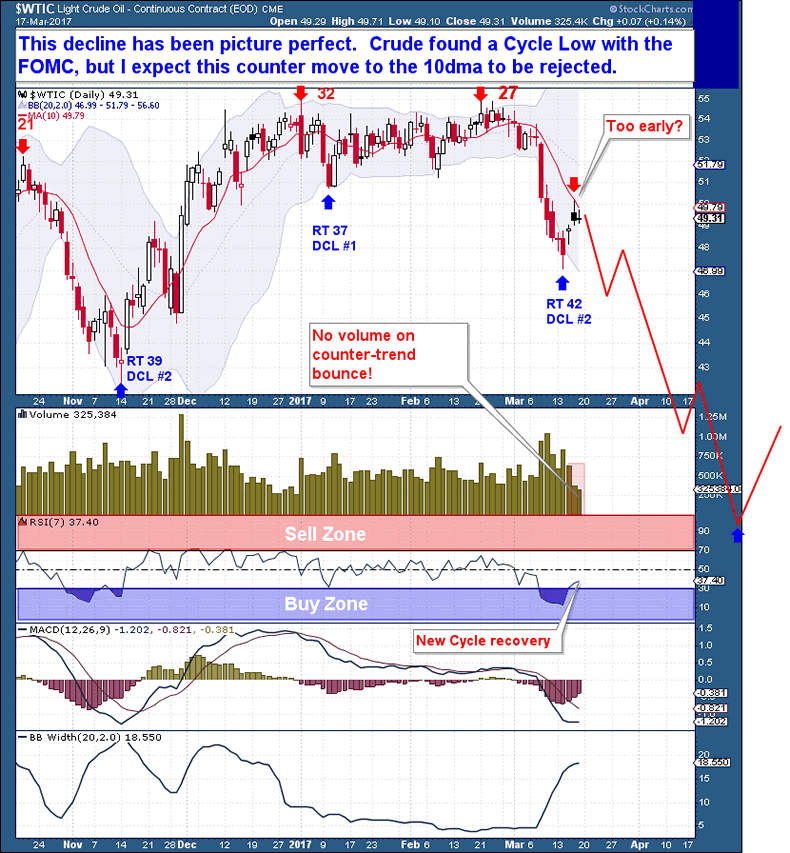
The COT report has improved somewhat, so obviously the “easy money” has been made on the short side. But the report remains bearish, and only tells me that the process of shifting from excessive long to short is still in progress, and will take time to complete. This also matches the fact that crude is now in an Investor Cycle decline, that process will be aided by leveraged longs capitulating and speculators picking up more short positions.
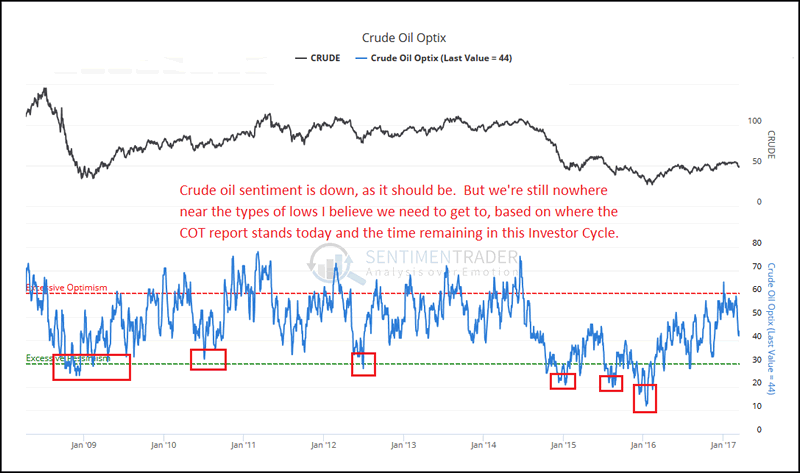
Interestingly too, crude oil sentiment is down, as expected…but still nowhere near the types of lows I believe we need to get to. When we consider the bearish COT report and the amount of time remaining in this Investor Cycle, I feel that we still have some way to go before looking for a meaningful bottom.
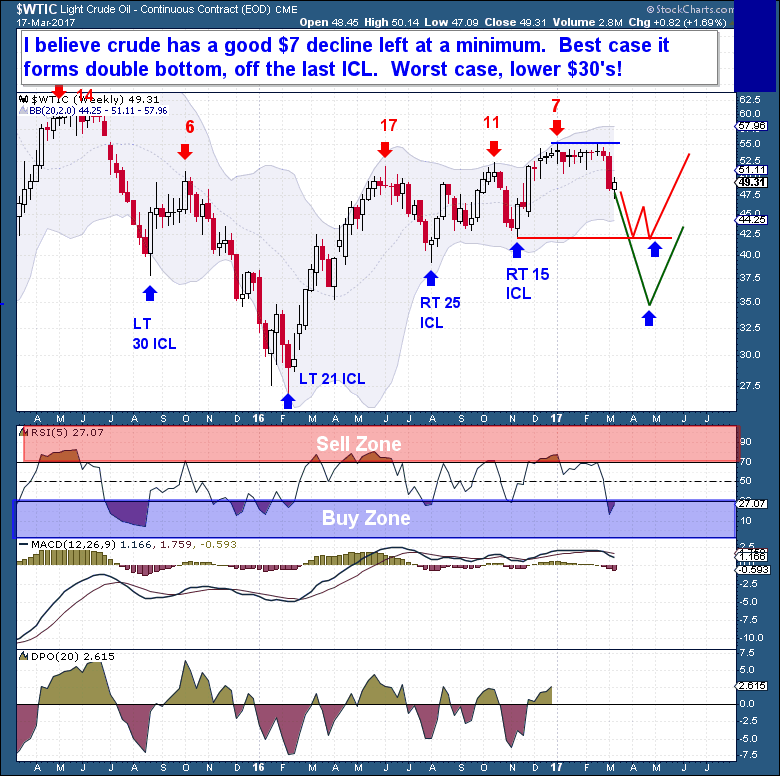
To the weekly chart, where I see a lot of downside work left in that chart. Now that this Cycle has given way and is in the declining portion, there is just no way it ends until it at least becomes oversold and touches the lower Bollinger bands. That would be the best case scenario for the bulls.
Therefore, it is my expectation that crude will fall another $7, at a minimum. Thereafter, it’s really anyone’s guess whether this ICL becomes a double bottom retest (around $42/$43) with the last ICL. Or in the worst case, this becomes a rout/crash that can be compared to the 2008 or 2014 declines. In that case, the downside over just the next two months is as far down as the low $30’s!
The Financial Tap – Premium
The Financial Tap publishes two member reports per week, a weekly premium report and a midweek market update report. The reports cover the movements and trading opportunities of the Gold, S&P, Oil, $USD, US Bond’s Cycles. Along with these reports, members enjoy access to a real-time portfolio with trade alerts.
Performance
The Financial Tap is primarily geared towards helping traders and Investors become better. We walk you through the process of Trade Setup and identification through the study of market Cycles. There is an extreme emphasis placed on Risk Management and on preserving capital.
For the past 12 month period, the Financial Tap model portfolio is up 17.5%, without ever using options/margin and without ever risking more than 1% on any given trade idea. The max draw-down in that 12 month period has been just 2.8%.
For more information and membership options – Please click to join.
By Bob Loukas
© 2017 Copyright Bob Loukas - All Rights Reserved
Disclaimer: The above is a matter of opinion provided for general information purposes only and is not intended as investment advice. Information and analysis above are derived from sources and utilising methods believed to be reliable, but we cannot accept responsibility for any losses you may incur as a result of this analysis. Individuals should consult with their personal financial advisors.
© 2005-2022 http://www.MarketOracle.co.uk - The Market Oracle is a FREE Daily Financial Markets Analysis & Forecasting online publication.