


Stock Markets Set to Consolidate Rally
Stock-Markets / US Stock Markets Aug 10, 2008 - 04:34 PM GMTBy: Mike_Burk

The good news is: Friday, most of the major indices closed at their highest levels since the mid July lows.
Short Term - Last week all of the major indices were up, but, in a change for he worse, the blue chips were stronger than the secondaries. The Dow Jones Industrial Average(DJIA) was up 3.60%, the S&P 500 (SPX) up 2.86% while the S&P midcap was up 1.61% and the Russell 2000 (R2K) was up 2.53%. On Monday, new lows on both the NYSE and NASDAQ hit their highest levels since the day after the mid July price low. Both the NYSE and NASDAQ new low indicators are moving sharply upward so there should life left in this rally.
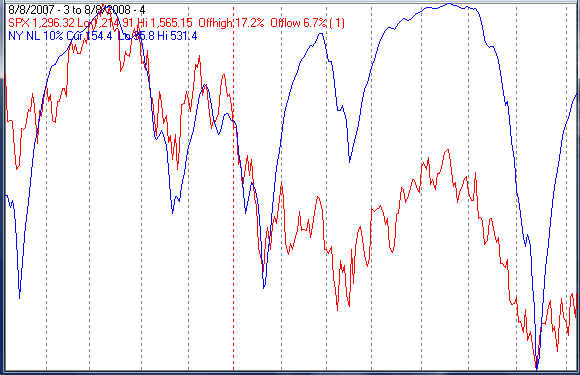
The chart below covers the past year showing SPX in red and a 10% trend (19 day EMA) of NYSE new lows (NY NL) in blue. NY NL has been plotted on an inverted Y axis so decreasing new lows move the indicator upward (up is good. Dashed vertical lines have been drawn on the 1st trading day of each month.
The next chart is similar to the one above except it shows the NASDAQ composite (OTC) in blue and the indicator calculated from NASDAQ new lows (OTC NL) in black.
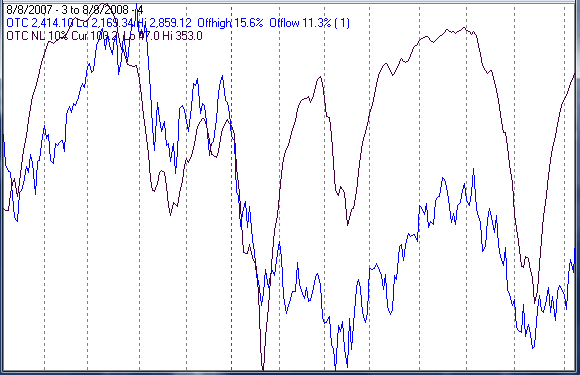
As long as both new low indicators are moving sharply upward there should be little risk to the long side of this market.
Intermediate Term
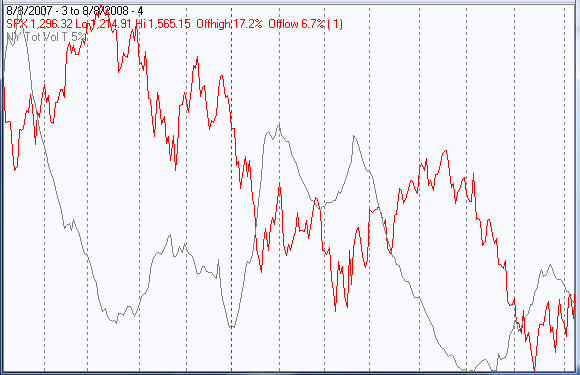
Volume has been a problem, it has been picking up on the declines and falling off on the advances. The chart below covers the past year showing the SPX in red and a 5% trend (39 day EMA) of NYSE volume in black.
Volume has been falling off on every rally over the past year.
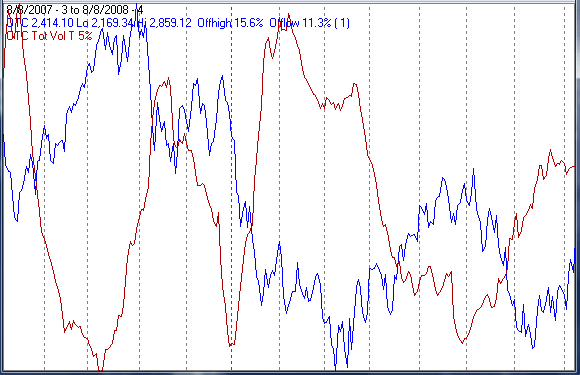
The next chart is similar to the one above except the index is the OTC in blue and a 5% trend of NASDAQ total volume in black.
Seasonality
Next week is the week prior to the 3rd Friday in August during the 4th year of the Presidential Cycle.
The tables show the daily return on a percentage basis for the 5 trading days prior to the 3rd Friday in August during the 4th year of the Presidential Cycle. OTC data covers the period from 1963 - 2007 and SPX data from 1953 - 2007. Prior to 1953 the market traded 6 days a week so that data has been ignored. There are summaries for both the 4th year of the Presidential Cycle and all years combined.
The market has been up a little more than half of the time over all years during the coming week, but, it has been down a little more than half of the time during the 4th year of the Presidential Cycle. The mean return has been positive over all periods.
Report for the week before the 3rd Friday of August.
The number following the year is the position in the presidential cycle.
Daily returns from Monday through 3rd Friday.
| OTC Presidential Year 4 | ||||||
| Year | Mon | Tue | Wed | Thur | Fri | Totals |
| 1964-4 | 0.22% | 0.05% | 0.17% | 0.00% | -0.22% | 0.22% |
| 1968-4 | 0.21% | 0.46% | 0.00% | 0.65% | 0.46% | 1.78% |
| 1972-4 | 0.02% | -0.17% | -0.01% | -0.50% | 0.48% | -0.19% |
| 1976-4 | -0.04% | 0.26% | -0.17% | -1.21% | -0.61% | -1.77% |
| 1980-4 | 0.70% | -0.28% | 0.23% | 0.98% | 0.63% | 2.26% |
| 1984-4 | -0.43% | -0.29% | -0.37% | 0.25% | 0.02% | -0.82% |
| Avg | 0.09% | 0.00% | -0.08% | 0.04% | 0.20% | 0.25% |
| 1988-4 | -1.29% | 0.43% | 0.15% | 0.27% | 0.05% | -0.39% |
| 1992-4 | -0.12% | -0.28% | -0.57% | 0.04% | -0.73% | -1.66% |
| 1996-4 | 0.09% | -1.06% | 0.65% | 0.11% | -0.09% | -0.31% |
| 2000-4 | 1.59% | 0.05% | 0.25% | 2.06% | -0.27% | 3.68% |
| 2004-4 | 1.46% | 0.70% | 2.01% | -0.63% | 1.00% | 4.54% |
| Avg | 0.34% | -0.03% | 0.50% | 0.37% | -0.01% | 1.17% |
| OTC summary for Presidential Year 4 1964 - 2004 | ||||||
| Avg | 0.22% | -0.01% | 0.23% | 0.20% | 0.07% | 0.67% |
| Win% | 64% | 55% | 60% | 70% | 55% | 45% |
| OTC summary for all years 1963 - 2007 | ||||||
| Avg | 0.22% | -0.04% | 0.25% | -0.01% | -0.08% | 0.34% |
| Win% | 64% | 50% | 63% | 52% | 56% | 53% |
| SPX Presidential Year 4 | ||||||
| Year | Mon | Tue | Wed | Thur | Fri | Totals |
| 1956-4 | -1.04% | 0.66% | 0.18% | -0.22% | -0.12% | -0.54% |
| 1960-4 | -0.09% | 0.19% | 0.21% | -0.05% | 0.35% | 0.62% |
| 1964-4 | 0.01% | 0.05% | -0.10% | -0.46% | 0.16% | -0.34% |
| 1968-4 | 1.03% | 0.53% | 0.00% | -0.47% | 0.62% | 1.72% |
| 1972-4 | 0.54% | -0.44% | -0.36% | -0.29% | 0.38% | -0.17% |
| 1976-4 | 0.17% | 0.35% | -0.23% | -1.12% | -0.99% | -1.81% |
| 1980-4 | 0.95% | -0.79% | -0.41% | 1.60% | 0.38% | 1.71% |
| 1984-4 | 0.01% | -0.61% | -0.99% | 0.60% | 0.23% | -0.77% |
| Avg | 0.54% | -0.19% | -0.50% | 0.06% | 0.12% | 0.14% |
| 1988-4 | -0.88% | 0.12% | 0.08% | 0.10% | -0.30% | -0.88% |
| 1992-4 | 0.20% | 0.14% | -0.75% | 0.02% | -0.82% | -1.21% |
| 1996-4 | 0.55% | -0.84% | 0.28% | 0.04% | 0.44% | 0.47% |
| 2000-4 | 1.34% | -0.48% | -0.31% | 1.10% | -0.29% | 1.36% |
| 2004-4 | 1.37% | 0.22% | 1.24% | -0.36% | 0.65% | 3.12% |
| Avg | 0.52% | -0.17% | 0.11% | 0.18% | -0.06% | 0.57% |
| SPX summary for Presidential Year 4 1956 - 2004 | ||||||
| Avg | 0.32% | -0.07% | -0.09% | 0.04% | 0.05% | 0.25% |
| Win% | 77% | 62% | 42% | 46% | 62% | 46% |
| SPX summary for all years 1953 - 2007 | ||||||
| Avg | 0.18% | 0.00% | -0.02% | 0.02% | 0.06% | 0.25% |
| Win% | 65% | 51% | 56% | 49% | 62% | 53% |

Conclusion
The market is overbought, but the indicators are strong so we are likely to see some consolidation next week.
I expect the major indices to be higher on Friday August 15 than they were on Friday August 8.
Thank you,
By Mike Burk
To subscribe to this report : http://alphaim.net/signup.html
Gordon Harms produces a Power Point for our local timing group. You can get a copy of that at: http://www.stockmarket-ta.com/ .
Disclaimer: Mike Burk is an employee and principal of Alpha Investment Management (Alpha) a registered investment advisor. Charts and figures presented herein are believed to be reliable but we cannot attest to their accuracy. Recent (last 10-15 yrs.) data has been supplied by CSI (csidata.com), FastTrack (fasttrack.net), Quotes Plus (qp2.com) and the Wall Street Journal (wsj.com). Historical data is from Barron's and ISI price books. The views expressed are provided for information purposes only and should not be construed in any way as investment advice. Furthermore, the opinions expressed may change without notice.
Mike Burk Archive |
© 2005-2022 http://www.MarketOracle.co.uk - The Market Oracle is a FREE Daily Financial Markets Analysis & Forecasting online publication.