


Brent Crude Oil Price Technical Update: Low Volatility Leads to High Volatility
Commodities / Crude Oil Feb 20, 2017 - 10:22 PM GMTBy: MarketsToday

 Since our last update on oil two months ago (Dec. 22, 2016) Brent Crude has not gone far, rising approximately 2.4% from 54.82 to 56.16 today. During this time it has traded within a relatively tight range (low volatility), from around a low of 53.61 to a high of 58.35.
The chart pattern that has formed in the past two months is either a bullish symmetrical triangle trend continuation pattern or a bearish head and shoulders top. Whichever way the breakout goes should confirm the next direction, either a continuation higher of the 13-month uptrend, or a deeper retracement off the 58.35 high.
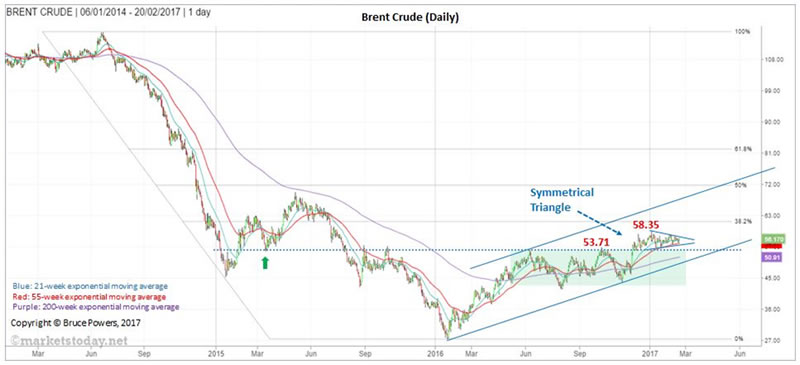
We should know which way Brent is going to go within the next one to two weeks as price is getting close to the apex of the triangle. A valid triangle should breakout before moving more than three quarters towards the apex.
Bullish Case
Brent has been in an uptrend since hitting a bottom at 27.13 in January 2016. In December further confirmation for the uptrend was given as a bullish trend continuation signal triggered on the rise above 53.71 (top of four-month base). The subsequent two-month plus consolidation phase has formed around support at the top of that pattern (resistance becomes support) and at support of the 55-day exponential moving average (ema). These are bullish indications.
At this point a breakout of the symmetrical triangle will be triggered on a decisive rally above 56.92 and confirmed on a daily close above the most recent swing high of 57.41.
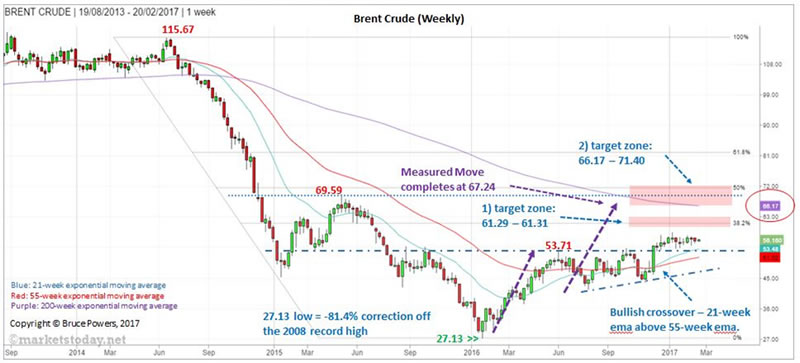
Upside Targets
First target zone = 61.29 to 61.31
- 61.29, triangle target
- 61.31, 38.2% Fibonacci retracement
Second target zone = 66.17 to 71.40
- 66.17, 200-day ema
- 67.24, completion of measured move or AB:CD pattern
- 69.59, prior swing high resistance from May 2015
- 71.40, 50% retracement of decline off June 2014 peak of 115.67
Bearish Case
The two month consolidation pattern may turn out to be a head and shoulders top. We won’t know whether the pattern is a valid bearish pattern until it is confirmed with price breaking down. A bearish trigger first occurs on a drop below the 55-day ema (now at 54.07), and it is confirmed on a drop below and subsequent daily close below the most recent swing low at 54.48.
Note in the chart below that the 55-day ema has merged with the 55-day ema. This makes a breakdown a little more significant as two indicators are identifying a similar price support level.
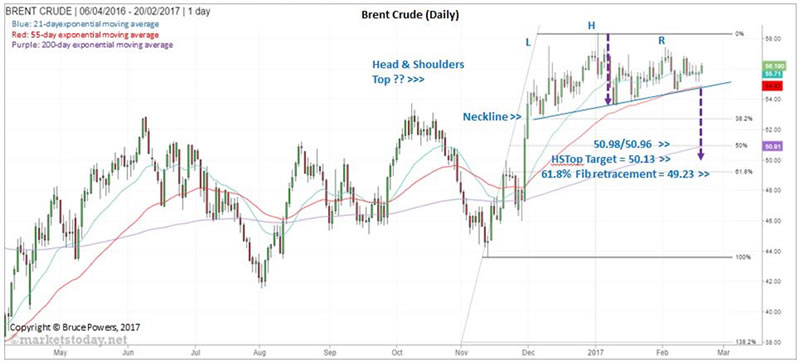
Following a breakdown lower targets include:
- 50.98/50.91, consisting of the 50% retracement and 200-day ema, respectively
- 49.74, minimum target for the head and shoulders top
- 49.23, 618% Fibonacci retracement
Bruce Powers, CMT
Chief Technical Analyst
http://www.marketstoday.net/
© 2017 Copyright Bruce Powers- All Rights Reserved
Disclaimer: The above is a matter of opinion provided for general information purposes only and is not intended as investment advice. Information and analysis above are derived from sources and utilising methods believed to be reliable, but we cannot accept responsibility for any losses you may incur as a result of this analysis. Individuals should consult with their personal financial advisors.
© 2005-2022 http://www.MarketOracle.co.uk - The Market Oracle is a FREE Daily Financial Markets Analysis & Forecasting online publication.