


Gold Price 50-DMA Breakout
Commodities / Gold and Silver 2017 Jan 19, 2017 - 02:57 PM GMTBy: P_Radomski_CFA

 In yesterday's alert, we wrote that the decline in the USD Index was likely a temporary phenomenon based on the investor's needless overreaction - the USD reversed and more than erased this week's decline. The metals' reaction was also in tune with our expectations - they reversed. Was this just a one-day phenomenon and will gold rally based on its recent breakout above its 50-day moving average or can we expect more declines in the following days?
The latter scenario seems much more probable. We've seen gold hit a strong resistance level (a combination of such levels), a support in the USD Index, reversals in the latter and in silver around their turning points, underperformance of mining stocks relative to gold and very short-term outperformance of silver. Additionally, we saw bearish confirmations from a few ratios and gold's reaction to the USD's declines was temporarily weakened. All the above happened as precious metals were making headlines and among increased interest in the sector. That's a very bearish combination - the outlook is more bearish than it was in the past days and thus we are now increasing the size of the speculative short position.
Let's take a look at the charts (charts courtesy of http://stockcharts.com) for details.
In yesterday's alert, we wrote the following:
The USD Index moved even lower yesterday, but gold didn't move higher than it was when we wrote the above (about $1,217). In other words, gold didn't respond to an additional decline. This suggests that even if the USD Index drops further, gold may not rally or may not rally far. However, if the USD rebounds visibly, gold is likely to be affected negatively to a great extent.
Can the USD Index rally shortly? Naturally - it moved back to the December 2015 high (even a bit below it) and is now back at 100.67 at the moment of writing these words (gold is at $1,212), so it appears that the move above the December 2015 high is verified. Plus, the turning point suggests that a reversal is upon us and the most recent move was definitely down - the implications are bullish.
Why did the USD Index plunge so significantly yesterday? Trump said that the USD was too strong. Did this materially change anything? No - that's an opinion of an important person, but that doesn't change the fact that the interest rates in the U.S. are most likely going higher and the rates in the EU and other parts of the world are unlikely to move higher (the opposite appears more likely). Consequently, the USD Index should not be impaired in the coming months and yesterday's reaction is likely emotional and temporary.
The USD Index erased the entire decline that we saw this week (being up 0.04 this week based on yesterday's closing price) as it bounced off the rising red support line and - approximately - the December 2015 highs. The breakout above the latter seems to have been verified. The implications are bullish.
Our yesterday's comments remain up-to-date:
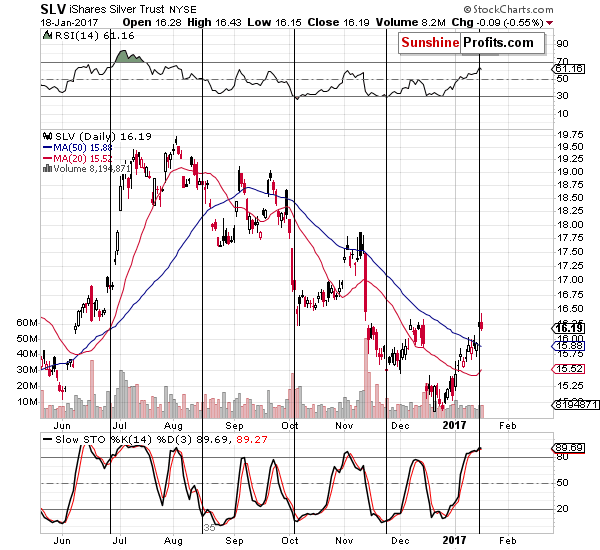
Silver rallied right at its turning point and it outperformed gold on a very short-term basis, which is a very bearish combination. As soon as silver declines a little (and it's likely to), a sell signal from the Stochastic indicator based on the SLV ETF will also emerge, further confirming the bearish case. It appears that we are on the verge of another significant decline in the white metal.
Silver outperformed once again by moving to new intra-day highs before turning south - gold didn't move above Tuesday's highs. Since the above is very often seen at local tops and right before big declines, it should not be ignored, especially that we just saw a repeat of the signal, which made it even more prominent.
In the case of gold, we wrote the following yesterday:
Gold moved to $1,219 today, so the 50% Fibonacci retracement was reached and that was almost the case with the declining red resistance line. In light of the turning points and support being reached in the USD Index, it seems likely that today's session is the final reversal (or extremely close to it) - perhaps today's session or the following one will be just like the session after the U.S. Presidential elections - with gold sliding quickly right after the uncertainty had peaked.
Gold didn't slide as much as previously, but still, it stopped the rally after moving to the 50% Fibonacci retracement and the declining resistance line. Gold also closed below the March / May 2016 lows in terms of daily closing prices. Without a breakout, the move higher is likely just a verification of the breakdown.
The above remains up-to-date. Gold closed the day at $1,204 (even though the Stockcharts.com's data seems to suggest otherwise) so we saw a quite profound daily reversal and a close back below the 38.2% Fibonacci retracement (based on daily closing prices). The implications are bearish.
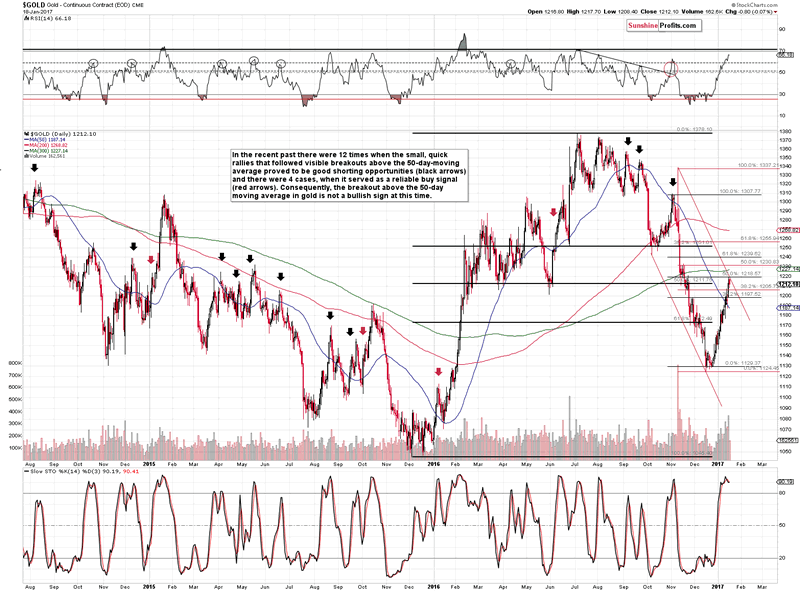
Before moving to mining stocks, we would like to discuss the issue of the 50-day moving average and gold's recent breakout above it. It has been described as something that is likely to make gold's rally sustainable, or at least make it bigger than it currently is.
The above chart includes black arrows and red arrows. All arrows mark situations in which gold broke visibly (we didn't count temporary moves a little above / below it that appeared accidental) above the 50-day moving average. Black arrows represent situations in which the breakout was followed by a very short-term rally (usually very similar to the one that we saw this month) that turned out to be excellent shorting opportunities. The red arrows represent situations in which the small post-breakout rallies were followed by much bigger rallies (and thus the breakout was indeed a bullish signal). Out of 16 cases that we can see above, there were 12 cases that were shorting opportunities and 4 cases that were buying opportunities.
The question is: should one trust the bullish analogies that had a 25% (4 out of 16) efficiency or the bearish analogies that had a 75% (12 out of 16) efficiency? We think the latter is much more justified, but at the same time we would like to stress that it is not a major reason due to which we think that precious metals are heading lower - it's a supplementary reason that is only moderately useful. Why? Because in the most recent past the efficiency of the bearish signals would be 3 out of 5, which is close to 50% - so it doesn't seem to be a particularly reliable factor. Still, if we had to pick if its more bullish or bearish, we would go with the latter interpretation.
As far as mining stocks are concerned, we previously wrote the following:
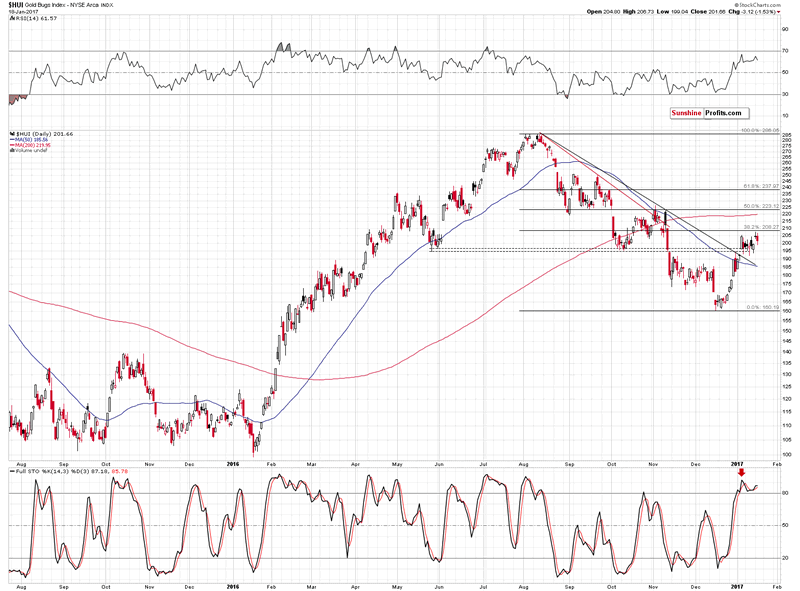
Since gold moved higher, gold miners are also likely to move a little higher, but the 38.2% Fibonacci retracement will likely keep the rally in check. Miners have been underperforming gold for several days (bearish implications) and the implications are bearish.
(...) gold miners moved very close to the 38.2% Fibonacci retracement, but there was no move back above it - the rally that we saw recently appears to be nothing more than a correction after a big decline.
Gold stocks haven't plunged violently yet, but they did close back below the January 5 high even though gold didn't. Overall, the miners' underperformance continues and it has bearish implications for the precious metals sector.
Summing up, the bearish medium-term outlook remains in place and based on silver's short-term outperformance, reversals in it and in the USD Index along with other factors, it appears that the short-term outlook has deteriorated once again. You will find detailed implications of the above situation on our trading positions in our Gold & Silver Trading Alerts.
Thank you.
In order to stay updated on our latest thoughts on the precious metals market (including thoughts not available publicly), we invite you to sign up for our free gold mailing list. You'll also get free 7-day access to our premium Gold & Silver Trading Alerts. Sign up today.
Sincerely,
Przemyslaw Radomski, CFA
Founder, Editor-in-chief
Tools for Effective Gold & Silver Investments - SunshineProfits.com
Tools für Effektives Gold- und Silber-Investment - SunshineProfits.DE
* * * * *
About Sunshine Profits
Sunshine Profits enables anyone to forecast market changes with a level of accuracy that was once only available to closed-door institutions. It provides free trial access to its best investment tools (including lists of best gold stocks and best silver stocks), proprietary gold & silver indicators, buy & sell signals, weekly newsletter, and more. Seeing is believing.
Disclaimer
All essays, research and information found above represent analyses and opinions of Przemyslaw Radomski, CFA and Sunshine Profits' associates only. As such, it may prove wrong and be a subject to change without notice. Opinions and analyses were based on data available to authors of respective essays at the time of writing. Although the information provided above is based on careful research and sources that are believed to be accurate, Przemyslaw Radomski, CFA and his associates do not guarantee the accuracy or thoroughness of the data or information reported. The opinions published above are neither an offer nor a recommendation to purchase or sell any securities. Mr. Radomski is not a Registered Securities Advisor. By reading Przemyslaw Radomski's, CFA reports you fully agree that he will not be held responsible or liable for any decisions you make regarding any information provided in these reports. Investing, trading and speculation in any financial markets may involve high risk of loss. Przemyslaw Radomski, CFA, Sunshine Profits' employees and affiliates as well as members of their families may have a short or long position in any securities, including those mentioned in any of the reports or essays, and may make additional purchases and/or sales of those securities without notice.
Przemyslaw Radomski Archive |
© 2005-2022 http://www.MarketOracle.co.uk - The Market Oracle is a FREE Daily Financial Markets Analysis & Forecasting online publication.