


Stock Market Consolidation?
Stock-Markets / Stock Markets 2016 Dec 18, 2016 - 06:51 PM GMTBy: Andre_Gratian

 Current Position of the Market
SPX Long-term trend: If the market strength persists, the long-term trend may need to be re-evaluated.
SPX Intermediate trend: SPX intermediate P&F count to 2270 has now been met, but there are higher counts that could still be filled before a serious reversal take place.
Analysis of the short-term trend is done on a daily-basis with the help of hourly charts. It is an important adjunct to the analysis of daily and weekly charts which discuss longer market trends.
Consolidation?
Market Overview
Upon reaching the lowest of the three projections I gave in the last letter (2770), SPX had a thirty-point pull-back. The trigger was the Fed's first interest increase in a year and the likelihood that there will be several more next year. Although the consolidation is only three days old, the Point & Figure chart shows that a lot of stock has already changed hands, and we may be ready to make an attempt at resuming the uptrend.
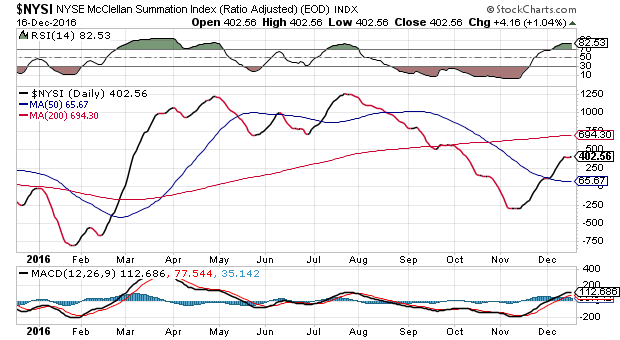
There are potential higher projections for the uptrend which started at 1810, even beyond those given last week, so we may not be ready for a serious correction just yet despite a sentiment index which still shows extreme greed. Additionally, market breadth, as depicted in the NYSI (below, courtesy of StockCharts.com) has lagged noticeably since the beginning of the "Trump rally". And finally, the relative weakness of the QQQ to SPX completes a trifecta of underlying negatives which belie the current market strength. However, only when price itself begins to show more than temporary weakness can we surmise that a serious correction has begun, starting with the breaking of the trend line from 2084.
Analysis
Daily chart
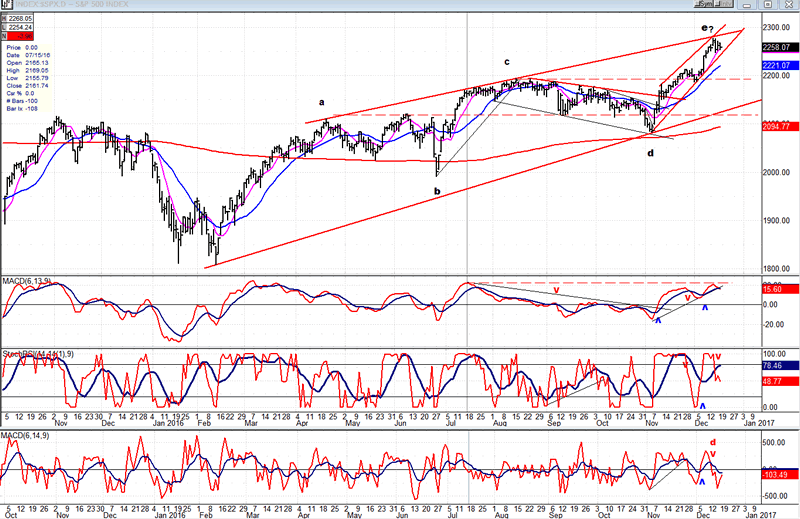
Since its beginning at 1810, the SPX chart pattern is taking on the appearance of a diagonal (an ending diagonal for the bull market?). If we cannot improve on this formation, considering the negatives pointed out in the Market overview, and especially if we turn the current consolidation into a correction and break out of the short-term channel -- which itself looks like a diagonal – the bearish case will have strengthened. Of course, that's a lot of "ifs" and it would take an extension of the decline below the dashed line before things really start getting bearish.
A look at the oscillators shows that over the short term, the A/D indicator has the same sluggish pattern that appears in the intermediate chart of the NYSI above. The MACD has turned down and may be ready to make a bearish cross, but it topped without showing negative divergence and would have to decline a good deal more to show some real weakness. The SRSI did give a sell signal as it made a bearish cross and, more importantly, it exhibits negative divergence in its slower (blue) MA which has stopped going up but cannot roll over unless the index declines further.
This chart and others below, are courtesy of QCharts.com.
Hourly chart
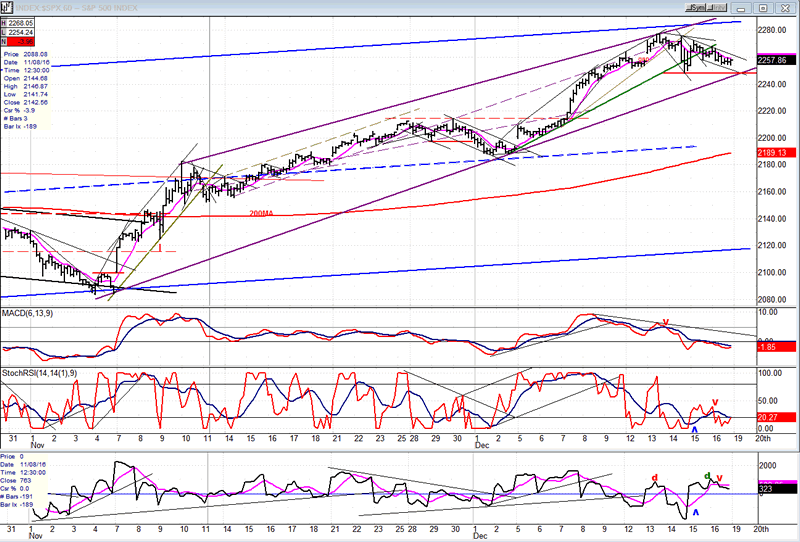
After having spent most of Friday's session going sideways in a very narrow range, the hourly chart looks ready to turn and, at the very least, challenge the strong resistance level of 2270ish. I have drawn two converging channel lines which suggest that the short-term pattern is also beginning to look like a diagonal. Prices could push a little higher without altering the formation, but if much more strength develops, not only the short-term diagonal would be at risk, but the intermediate one as well.
Enough accumulation has already taken place to send prices up to the 2300 level if SPX can get past the 2270 and 2286 resistance levels. In fact, there is enough accumulation to move up to 2330, but the pattern is divided into several short projection phases, and a resumption of the advance could stop after completing any one of them.
While the daily oscillators are still in a decline, the hourly are oversold and ready to turn up. This is particularly evident in the A/Ds which remained positive during all of Friday's trading.
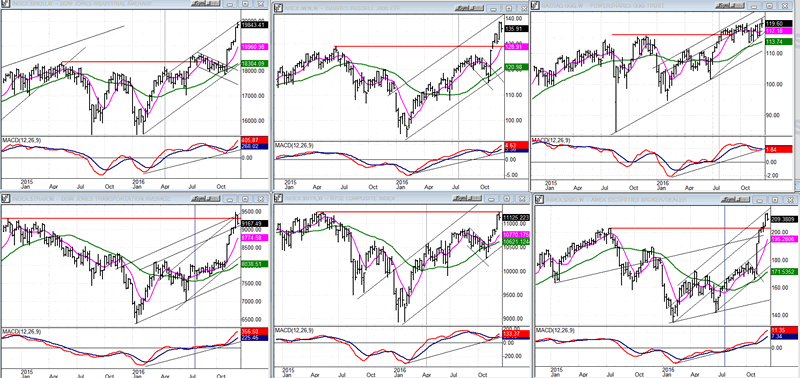
An overview of some major indexes (Weekly charts)
A consolidation of a few days has not changed the weekly pattern, and it remains essentially the same as it was last week. The QQQ did make a slightly new high, but it is not yet enough to significantly lessen its relative weakness to SPX.
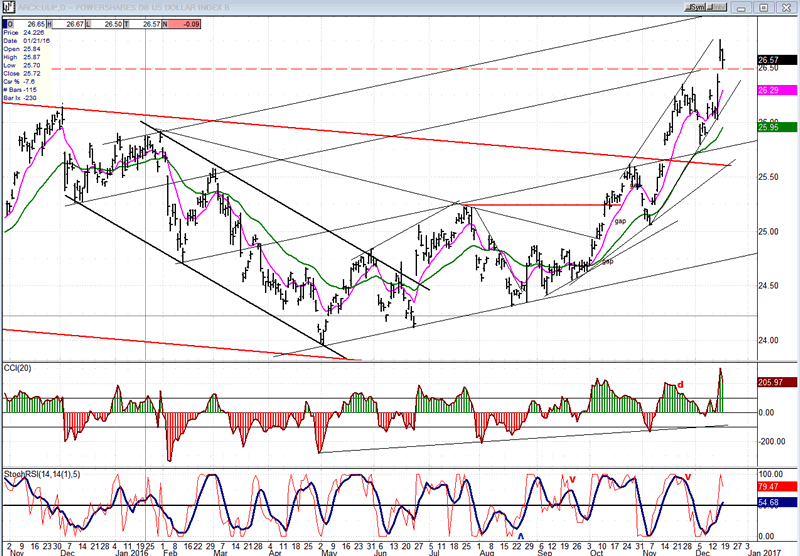
UUP (dollar ETF)
UUP took advantage of the rate increase to surge to a 7-year high. It could push to about 27.00 before beginning to consolidate. But we need to keep in mind that higher levels are still likely, with prices eventually reaching at least 28-29.
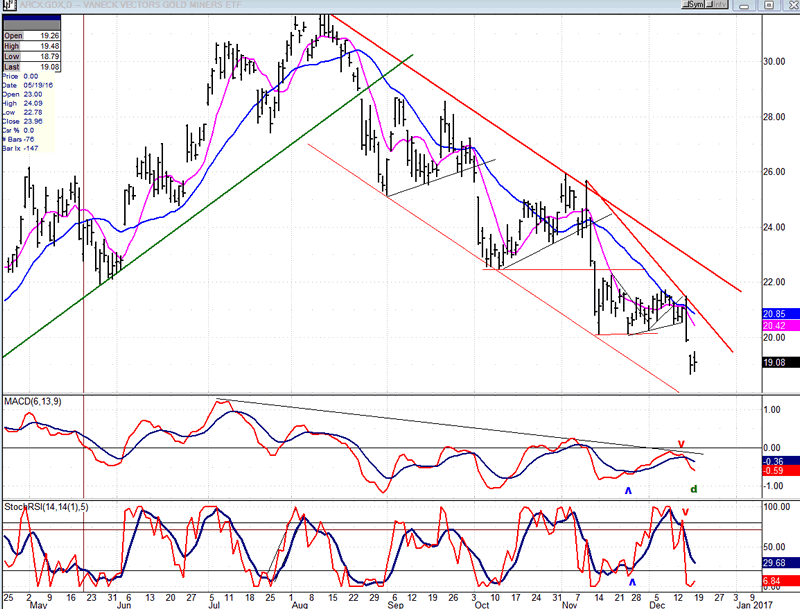
GDX (Gold Miners ETF)
GDX's reaction to the interest rate hike was the exact opposite of UUP's. It has now declined to the lower projection levels of 18.50-19.00 which were discussed in previous letters. Unfortunately for the gold enthusiasts, this may not be the end of the correction and, after a rebound of sorts, there could be another drop to about 16.00. Some real buying causing a break of the major downtrend line would need to take place before we could say that an important reversal has occurred.
Note: GDX is now updated for subscribers several times throughout the day (along with SPX) on Marketurningpoints.com.
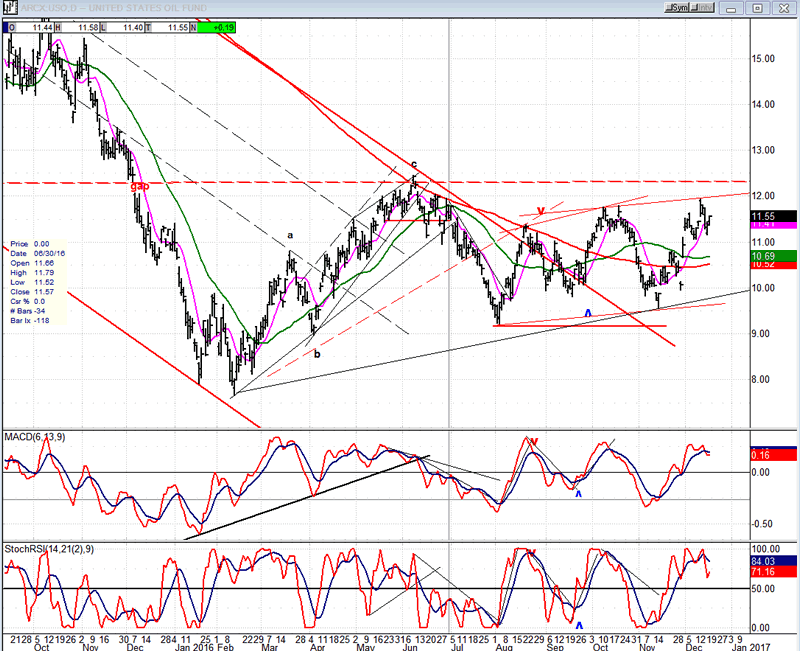
USO (U.S. Oil Fund)
USO has come to a decision point whereby it must show some immediate new strength in order to achieve a breakout of its base, or it will fall back to the level of its previous short-term lows.
Summary:
SPX is consolidating after reaching the lowest of the projections given in the previous letter. It is not clear if the index is already capable of extending its move beyond the 2270 resistance level. The hourly indicators appear ready to push higher, but the daily are still correcting. A little more time is needed to decide. In any case, it would be premature to call this the start of a major top.
Andre
FREE TRIAL SUBSCRIPTION
If precision in market timing for all time framesis something that you find important, you should
Consider taking a trial subscription to my service. It is free, and you will have four weeks to evaluate its worth. It embodies many years of research with the eventual goal of understanding as perfectly as possible how the market functions. I believe that I have achieved this goal.
For a FREE 4-week trial, Send an email to: info@marketurningpoints.com
For further subscription options, payment plans, and for important general information, I encourage
you to visit my website at www.marketurningpoints.com. It contains summaries of my background, my
investment and trading strategies, and my unique method of intra-day communication with
subscribers. I have also started an archive of former newsletters so that you can not only evaluate past performance, but also be aware of the increasing accuracy of forecasts.
Disclaimer - The above comments about the financial markets are based purely on what I consider to be sound technical analysis principles uncompromised by fundamental considerations. They represent my own opinion and are not meant to be construed as trading or investment advice, but are offered as an analytical point of view which might be of interest to those who follow stock market cycles and technical analysis.
Andre Gratian Archive |
© 2005-2022 http://www.MarketOracle.co.uk - The Market Oracle is a FREE Daily Financial Markets Analysis & Forecasting online publication.