Stock Market What Can we Expect in December?
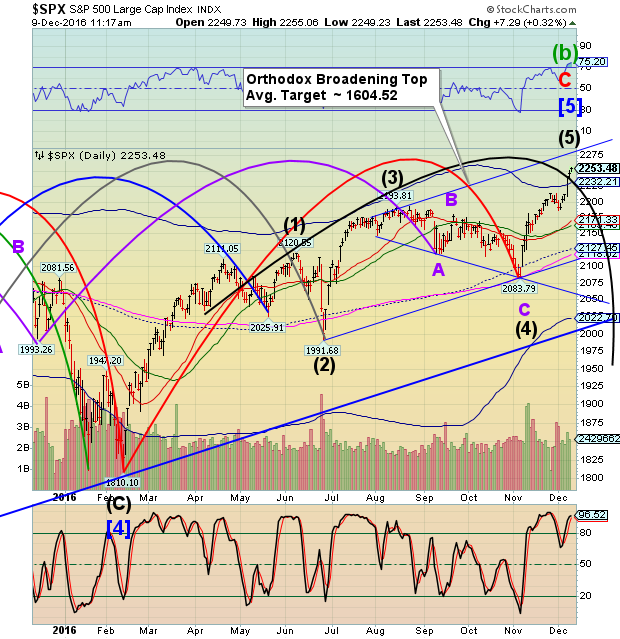
Stock-Markets / Stock Markets 2016 Dec 09, 2016 - 07:33 PM GMT SPX has closed above its daily Cycle Top at 2232.21 and met at least two Fibonacci targets at 2250.00 and 2255.00. It must close back beneath its Cycle Top to get a possible daily sell signal. Preferably Wave 1 should decline to or beneath last Friday’s low at 2187.44 before retesting the Cycle Top. The final challenge of the Cycle Top is the ideal short entry in this scenario.

Beyond that, Wave (1) may decline at least to the Cycle Bottom at 2022.70 or to the 5-year trendline near 2000.00. Again, the ideal decline would go beneath the Brexit low at 1991.68 to set up a clear long-term sell signal. That would be an 11.5% decline that, once reversed, would give an “all clear” for most investors and commentators who would claim that we missed the bullet again (a 20% “bear market” decline).
This also comports with the pattern in the Orthodox Broadening Top, which calls for a 4-6% decline beneath “point 4” at 2083.79.
The Cycles Model allows at least 8.6 days for this to happen, although it may extend another day or so. The reason I use these time periods is that the usual time period for an impulse is usually divisible by 4.3.
8.6 days from today’s high would be near the close of trading on Wednesday, December 21. However, Thursday December 22 is a Pi date, which may extend the decline another 4.3 hours. I am not expecting the decline to last beyond Thursday. Thereafter, the Model calls for a rally until January 6. The crash may happen after that, since the Model calls for a decline until early February. These dates are all guidelines that may be adjusted according to the progress of the decline.
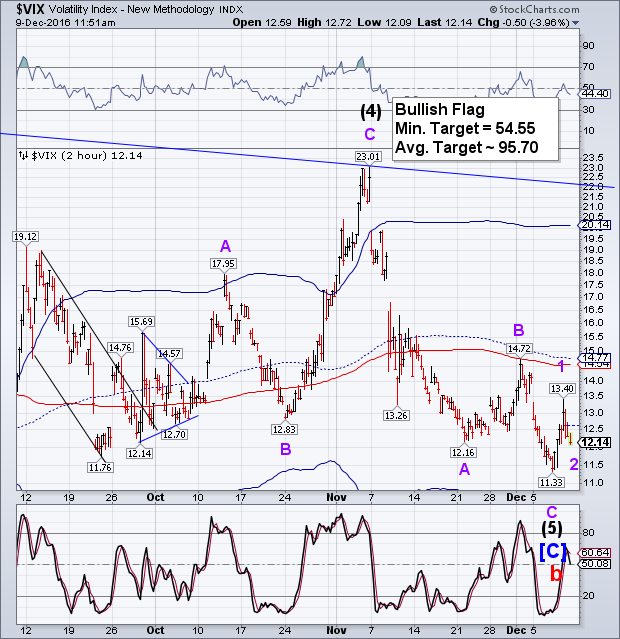
VIX made an apparent Impulsive rally from its low and a near-Fibonacci retracement of 63.3%. It is currently off its daily low and is currently oversold enough to resume its rally.

If the current structure is correct, VIX may have the capability to rally to or above its Cycle Top at 20.14 and Ending Diagonal trendline at or near 22.00 in Wave 3 of (1). The Brexit high in VIX was 26.72, which would be a fitting Wave 5 of (1) peak in VIX.
Simply put, Wave (1) must break the Ending Diagonal trendline to qualify it as a Super Cycle Wave (c) decline.
Regards,
Tony
Our Investment Advisor Registration is on the Web.
We are in the process of updating our website at www.thepracticalinvestor.com to have more information on our services. Log on and click on Advisor Registration to get more details.
If you are a client or wish to become one, please make an appointment to discuss our investment strategies by calling Connie or Tony at (517) 699-1554, ext 10 or 11. Or e-mail us at tpi@thepracticalinvestor.com .
Anthony M. Cherniawski, President and CIO http://www.thepracticalinvestor.com
As a State Registered Investment Advisor, The Practical Investor (TPI) manages private client investment portfolios using a proprietary investment strategy created by Chief Investment Officer Tony Cherniawski. Throughout 2000-01, when many investors felt the pain of double digit market losses, TPI successfully navigated the choppy investment waters, creating a profit for our private investment clients. With a focus on preserving assets and capitalizing on opportunities, TPI clients benefited greatly from the TPI strategies, allowing them to stay on track with their life goals.
Disclaimer: The content in this article is written for educational and informational purposes only. There is no offer or recommendation to buy or sell any security and no information contained here should be interpreted or construed as investment advice. Do you own due diligence as the information in this article is the opinion of Anthony M. Cherniawski and subject to change without notice.
Anthony M. Cherniawski Archive |
© 2005-2022 http://www.MarketOracle.co.uk - The Market Oracle is a FREE Daily Financial Markets Analysis & Forecasting online publication.


