


Will Crude Oil Price Rally to $50?
Commodities / Crude Oil Nov 22, 2016 - 05:40 PM GMTBy: Nadia_Simmons

 Trading position (short-term; our opinion): Long positions (with a stop-loss order at $41.39 and initial upside target at $49.53) are justified from the risk/reward perspective.
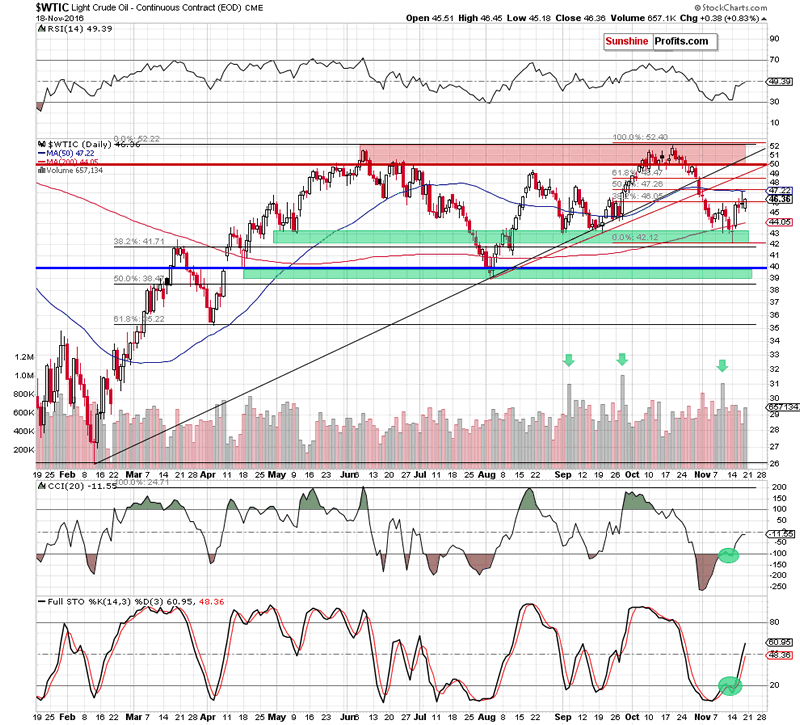
On Friday, crude oil moved higher once again as optimism over an OPEC deal to limit production continued to weigh on investors' sentiment. In this environment, light crude gained 0.83% and closed the day above the 38.2% Fibonacci retracement. What does it mean for the commodity?
Let's examine the charts below and find out (charts courtesy of http://stockcharts.com).
Quoting our Friday's alert:
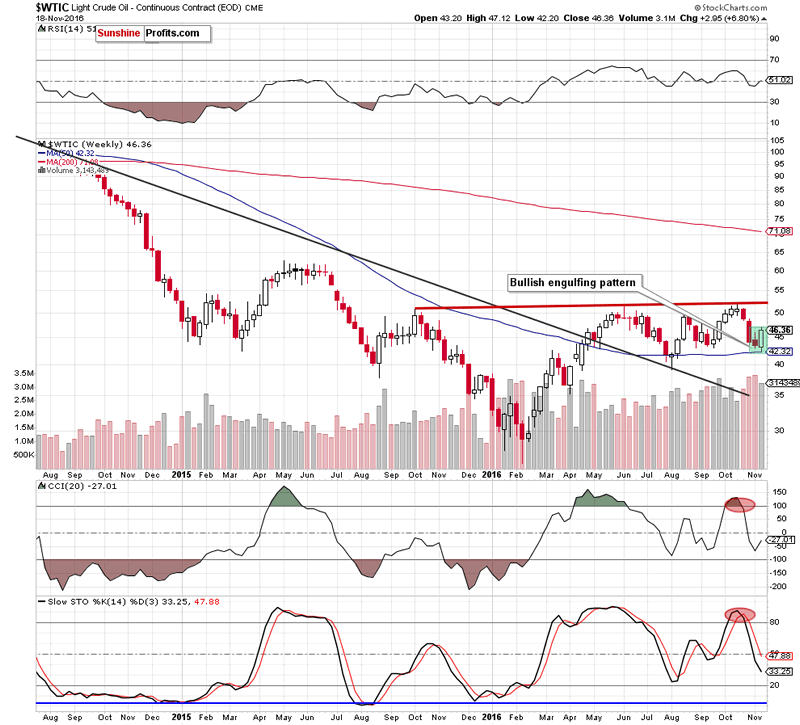
(...) oil bulls pushed the commodity higher as we had expected. With this increase light crude reached the previously-broken 50-day moving average, which in combination with the 50% Fibonacci retracement triggered a pullback. Despite this drop, crude oil closed the day above the last week's high, which looks like a verification of earlier breakout. If this is the case, light crude will extend gains (...)
From today's point of view, we see that the situation developed in line with the above scenario and crude oil rebounded, climbing above the 38.2% Fibonacci retracement and closing the day above the Nov 9 high. This suggests that Friday's verification of a breakout above this peak and its positive impact on the price will support oil bulls and trigger further improvement in the coming days.
How high could the black gold go in the coming days? We believe that the best answer to this question will be the quote from our previous alert:
(...) we'll see (at least) a re-test of yesterday's high. Nevertheless, taking into account the fact that buy signals generated by the indicators remain in place, we think that higher prices of crude oil (even an increase to the previously-broken red and black resistance lines) are very likely – especially if the black gold closes this week above the last week's high (in this case we'll see a bullish engulfing pattern on the weekly chart).
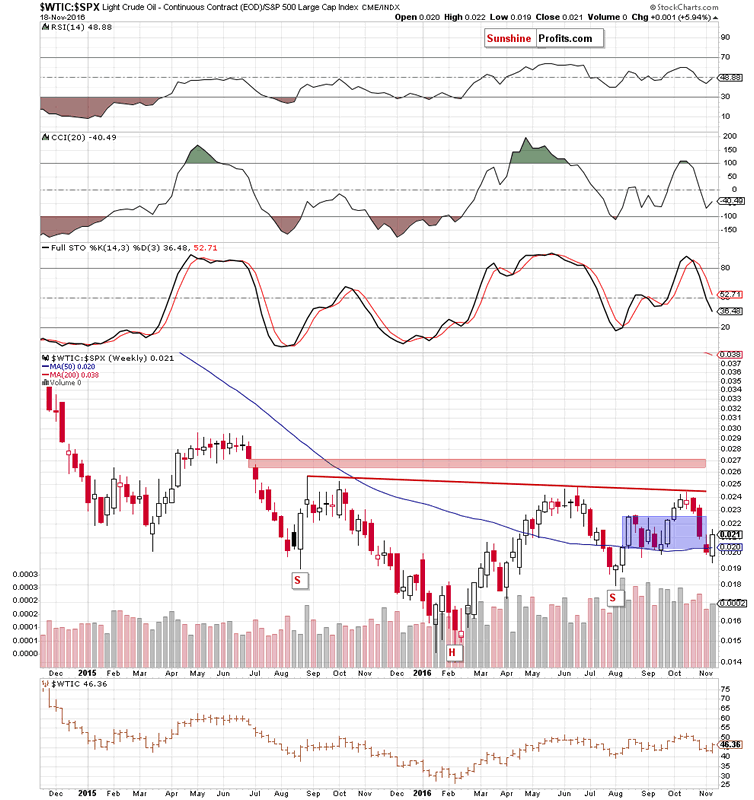
This pro-growth scenario is also supported by the current situation in the oil-to-stocks ratio.
On Friday, we wrote:
The first thing that catches the eye on the weekly chart of the oil-to-stocks ratio is invalidation of a breakdown under the 50-week moving average, which resulted in a rebound and a comeback to the blue consolidation.
What impact did this move have on the daily chart?
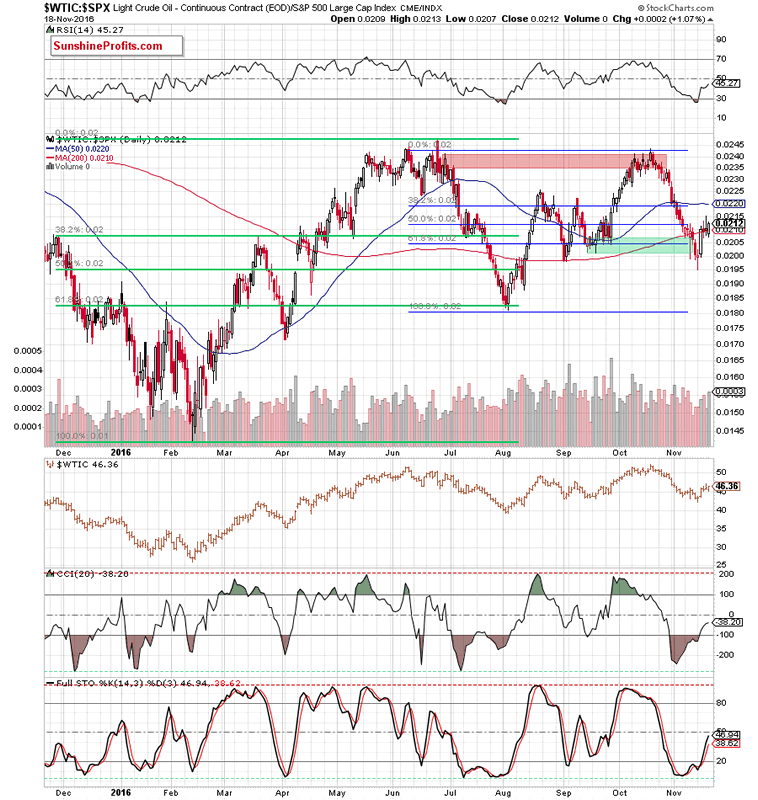
(...) the ratio came back above the 200-day moving average and the green support zone (invalidating earlier breakdowns), which in combination with buy signals generated by the indicators continues to support further improvement in the ratio and also in crude oil (as strong positive correlation remains in place). Additionally (similarly to what we wrote in the case of crude oil) if the ratio closes the week above the last week's high we'll receive one more pro-growth factor – a bullish engulfing pattern.
As you see on the above charts, the ratio closed the previous week above the Nov 9 high, which resulted in a creation of the bullish engulfing pattern (as we had expected). Additionally, invalidation of earlier breakdowns and its positive impact on the bulls is still in effect, which supports higher values of the ratio and crude oil in the coming week.
Summing up, crude oil increased above the 38.2% Fibonacci retracement and verified earlier breakout above the early Nov high, which in combination with the current situation in the oil-to-stocks ratio and buy signals generated by the indicators (in the case of crude oil and also in the ratio) suggests that higher prices of the black gold are just around the corner.
Very short-term outlook: bullish
Short-term outlook: bullish
MT outlook: mixed
LT outlook: mixed
Trading position (short-term; our opinion): Long (already profitable) positions (with a stop-loss order at $41.39 and initial upside target at -$49.53) are justified from the risk/reward perspective.
As a reminder – "initial target price" means exactly that – an "initial" one, it's not a price level at which we suggest closing positions. If this becomes the case (like it did in the previous trade) we will refer to these levels as levels of exit orders (exactly as we've done previously). Stop-loss levels, however, are naturally not "initial", but something that, in our opinion, might be entered as an order.
Thank you.
Nadia Simmons
Forex & Oil Trading Strategist
Przemyslaw Radomski
Founder, Editor-in-chief
Sunshine Profits: Gold & Silver, Forex, Bitcoin, Crude Oil & Stocks
Stay updated: sign up for our free mailing list today
* * * * *
Disclaimer
All essays, research and information found above represent analyses and opinions of Nadia Simmons and Sunshine Profits' associates only. As such, it may prove wrong and be a subject to change without notice. Opinions and analyses were based on data available to authors of respective essays at the time of writing. Although the information provided above is based on careful research and sources that are believed to be accurate, Nadia Simmons and his associates do not guarantee the accuracy or thoroughness of the data or information reported. The opinions published above are neither an offer nor a recommendation to purchase or sell any securities. Nadia Simmons is not a Registered Securities Advisor. By reading Nadia Simmons’ reports you fully agree that he will not be held responsible or liable for any decisions you make regarding any information provided in these reports. Investing, trading and speculation in any financial markets may involve high risk of loss. Nadia Simmons, Sunshine Profits' employees and affiliates as well as members of their families may have a short or long position in any securities, including those mentioned in any of the reports or essays, and may make additional purchases and/or sales of those securities without notice.
© 2005-2022 http://www.MarketOracle.co.uk - The Market Oracle is a FREE Daily Financial Markets Analysis & Forecasting online publication.