


Gold Price Forecast: Nasty Naughty November Gold Price Trend
Commodities / Gold and Silver 2016 Nov 22, 2016 - 03:24 AM GMTBy: I_M_Vronsky

 As all are well aware the price of gold initiated a new bull market since December 2015 (rising from $1,050 to its $1,376 peak in early July this year. Indeed it was a spectacular bull price run where gold soared more than +30% in only six months. Indeed spectacular!
Subsequently, the bull trend petered out in early July. Since then the price of gold has been steadily declining. Moreover, there are several reasons for this on-going price consolidation…and why it has yet to put in a bottom:
- 3-Month T-Bill Yield Soaring
- US$ Index Surges
- US$ vs 3-Month T-Bill
- Weekly $UST1Y vs USD Chart
- Point&Figure Projections (Gold, USD and Silver)
- Traditional November Gold Price Decline
Six Analytical Tells Suggesting A Lower Gold Price
3-Month T-Bill Yield Soaring
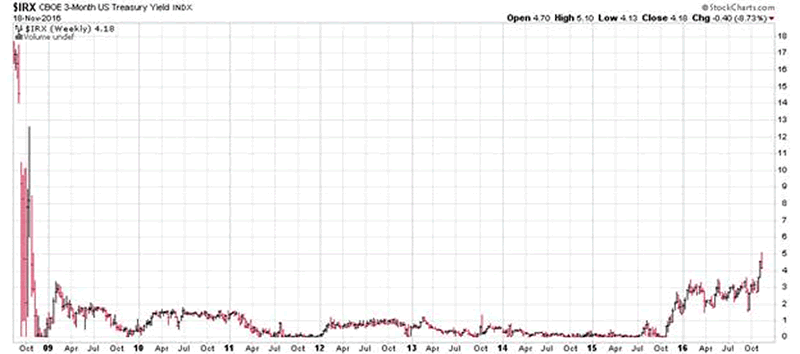
(Source: http://tinyurl.com/hbkzlbp )
The US 3-Month T-Bill yield has begun to soar. In fact it is presently at nearly 5%...an eight year high. As history is testament this will attract millions of international investors to the US Dollar. Correspondingly, the greenback should continue to rise (as shown in the following chart).
US$ Index Surges
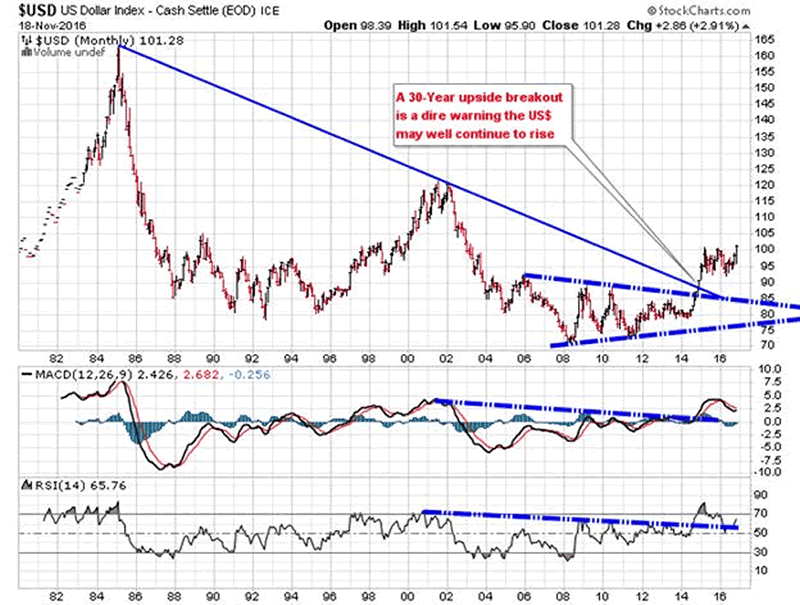
(Source: http://tinyurl.com/hj7nlf7 )
To be sure the gold price usually (but not always) runs inverse to the value of the US$ Index. Moreover, the above chart clearly shows the US$ has been slowly rising from early 2014, but has additionally built a Bull Flag Formation, which has recently broken above the bull pattern…thus signaling higher values for the US greenback.
US$ vs 3-Month T-Bill
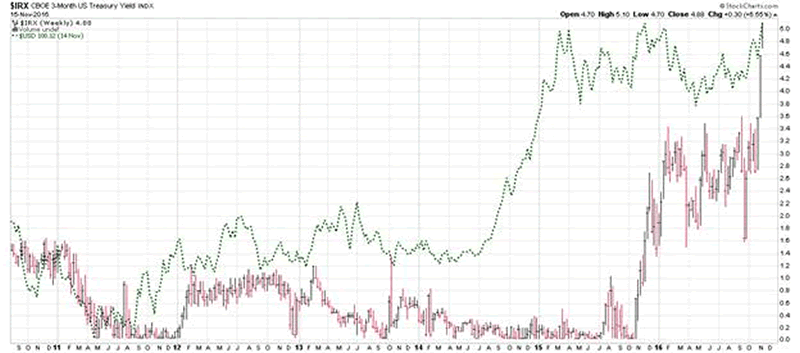
(Source: http://tinyurl.com/gv2avp8 )
Undeniably, since 2011 the US Dollar Index runs on-balance and in tandem with the US 3-Month T-Bill Yield. Moreover, the T-Bill yields have been surging upward during this month of November…thus suggesting further strengthening of the US$.
Weekly $UST1Y vs USD Chart
Clearly, the US Dollar Index runs overall and in approximate tandem with the US 1-Year Treasury Yield.
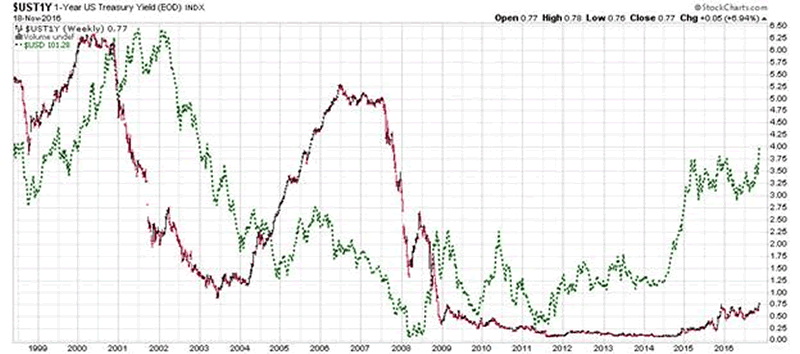
(Source: http://tinyurl.com/zegaooh )
Continued rising of these two metrics forecasts lower gold prices.
Point&Figure Projections (Gold, USD and Silver)
Point&Figure Analysis is NOT an exact science. Nonetheless, it is an additional indicator to help guide ones decision making to determine the possible price objectives going forward. Here are the most recent price objective charts of Gold, US$ and Silver per P&F Analysis.
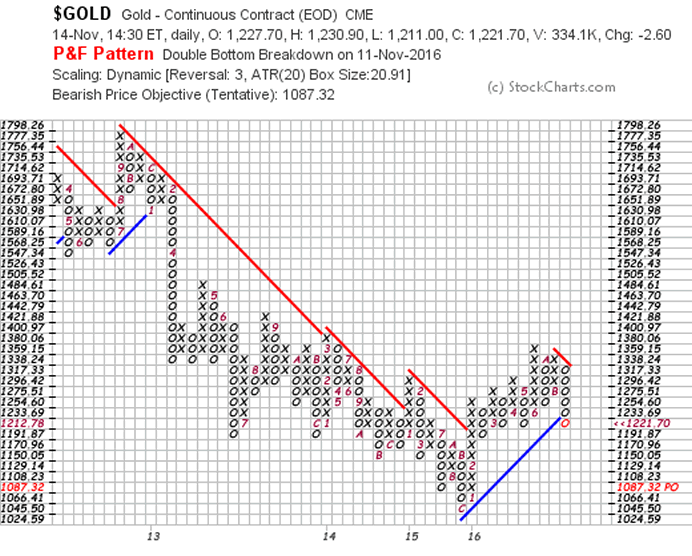
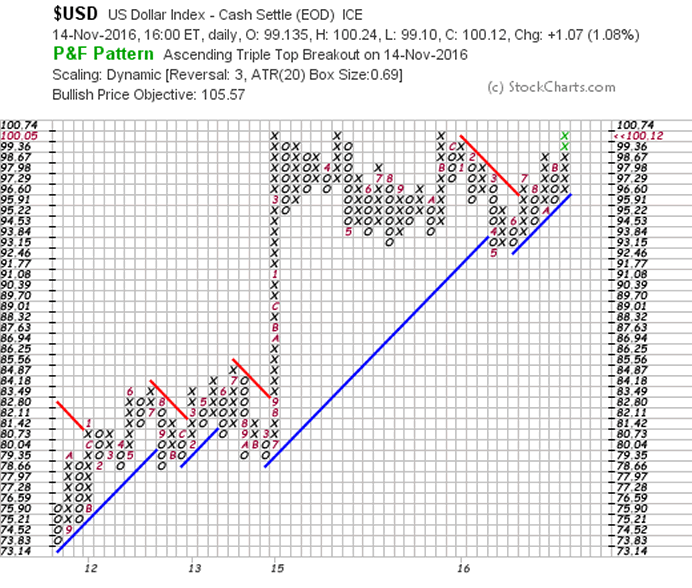
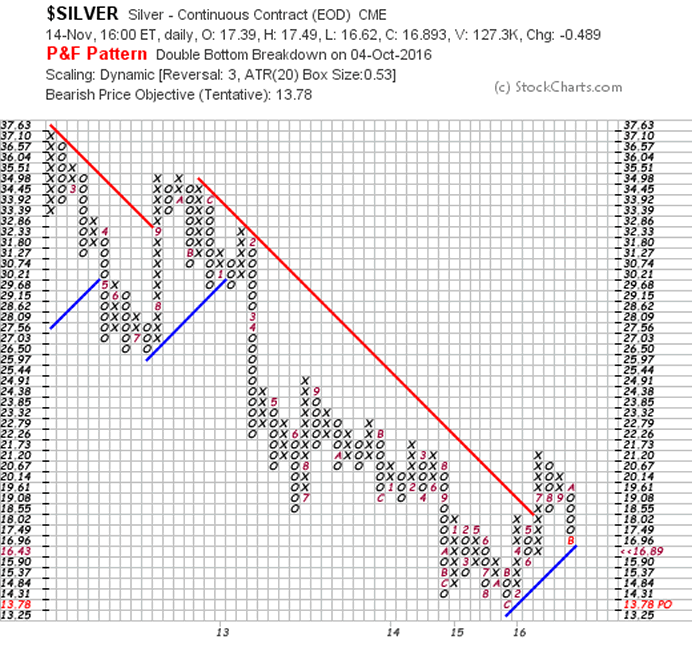
(Source: StockCharts)
Traditional November Gold Price Decline
Among the Analytical Six Tells Suggesting A Lower Gold Price, this analyst believes the most reliable gold price forecaster is the Traditional November Gold Price Decline.
Indubitably, the gold price in past Novembers has been an open season killer of Gold Bulls. Here is what occurred in Novembers past:
During November 2011 gold price fell -9.1%
During November 2012 gold price fell -4.1%
During November 2013 gold price fell -9.8%
During November 2014 gold price rose +1.1%
During November 2015 gold price fell -7.9%
Excluding the November 2014 results which was an anomaly to the traditional November price action, the average four year November decline for the price of gold was -7.7%. Applying this to the present situation, forecasts the possibility of gold dropping to about $1,175 sometime before December.
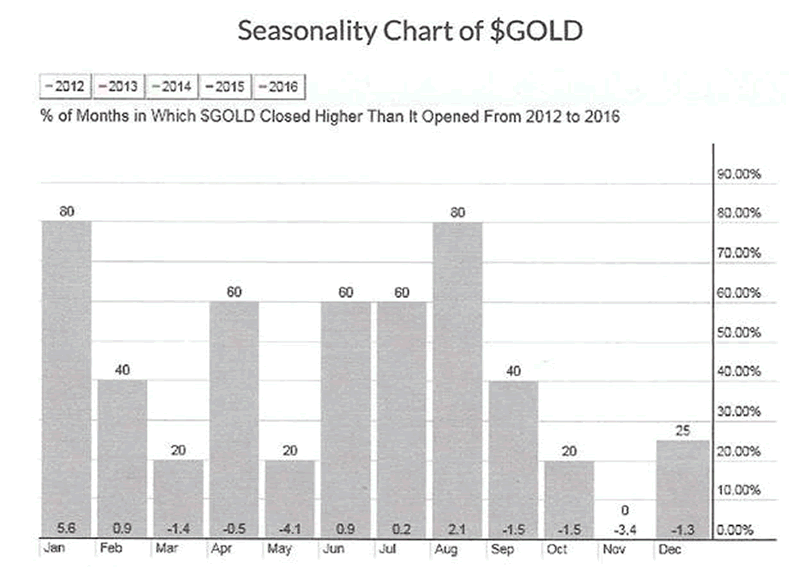
(Source: http://stockcharts.com/freecharts/seasonality.php?symbol=%24GOLD )
As the above Gold Seasonality table demonstrates, November is traditionally the worst month for the gold price (during the past five years – excluding 2014).
Summary And Conclusion
Based upon the overall conclusions of the above six tells suggesting a lower gold price, there is high probability the value gold may decline to about $1,175 by the end of this month (based upon the average November declines since 2011 - excluding 2014). And although Point&Figure analysis is NOT an accurate price forecasting metric, prudent investors should not exclude the possibility the price of gold may even fall to $1,087 (per the Double Bottom Breakdown as shown above in P&F). Additionally, a daily bar chart of gold shows a Bear Market Flag that has already triggered, thus producing a price objective of about $1,080…which might materialize sometime before yearend.
HOWEVER, once the bottom is established, the price of gold will indubitably soar to new all-time highs in 2017 and years beyond…as the US stock market plunges into a long overdue Bear Market. Moreover, the unprecedented 34 year bond bull market appears to be faltering…and may also plunge to begin a very long overdue BEAR MARKET TREND. Consequently and indubitably, panicked bond investors worldwide will flee to the historical safe-haven of gold.
By I. M. Vronsky
Editor & Partner - Gold-Eagle
www.gold-eagle.com
Founder of GOLD-EAGLE in January 1997. Vronsky has over 40 years’ experience in the international investment world, having cut his financial teeth in Wall Street as a Financial Analyst with White Weld. He believes gold and silver will soon be recognized as legal tender in all 50 US states (Utah and Arizona having already passed laws to that effect). Vronsky speaks three languages with indifference: English, Spanish and Brazilian Portuguese. His education includes university degrees in Engineering, Liberal Arts and an MBA in International Business Administration – qualifying as Phi Beta Kappa for high scholastic achievement in all three.
© 2016 Copyright I. M. Vronsky - All Rights Reserved
Disclaimer: The above is a matter of opinion provided for general information purposes only and is not intended as investment advice. Information and analysis above are derived from sources and utilising methods believed to be reliable, but we cannot accept responsibility for any losses you may incur as a result of this analysis. Individuals should consult with their personal financial advisors.
© 2005-2022 http://www.MarketOracle.co.uk - The Market Oracle is a FREE Daily Financial Markets Analysis & Forecasting online publication.