


Where Will Crude Oil Price Head Next?
Commodities / Crude Oil Oct 25, 2016 - 11:24 AM GMTBy: P_Radomski_CFA

 Trading position (short-term; our opinion): Short positions (with a stop-loss order at $53.22 and initial price target at $46) are justified from the risk/reward perspective.
On Friday, crude oil gained 0.43% after Russia renewed its commitment to joining a producers' output freeze. Thanks to this news, light crude bounced off session’s lows and closed the week slightly below $51. But did this move change anything in the overall picture of the commodity?
Let’s examine the charts below and find out (charts courtesy of http://stockcharts.com).
Quoting our Friday’s alert:
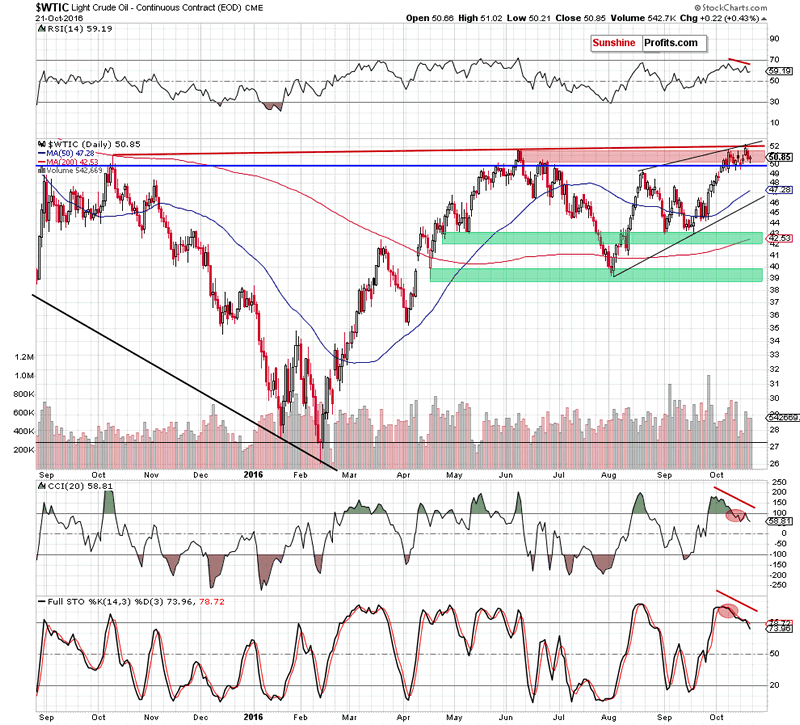
(…) although crude oil hit a fresh 2016 high, oil bulls didn’t manage to hold gained levels (not to mention further improvement), which resulted in a comeback below the Jun high. In this way, the commodity invalidated earlier breakout, which is a negative sign that suggests further deterioration (especially when we factor in the fact that the CCI and Stochastic Oscillator generated sell signals once again) and a test of (…) the barrier of $50 (...)
Looking at the above charts, we see that oil bears pushed crude oil lower as we had expected. With this drop the pair approached our first downside targe, hitting an intraday low of $50.21 on Friday. As you see, the proximity to the barrier of $50 encouraged oil bulls to act, but the size of the move is tiny compared to Thursday’s decline. Additionally, an invalidation of earlier breakouts is still in effect, suggesting lower prices of the commodity (especially when we add sell signals generated by the daily indicators) in the coming week.
On top of that, we should also keep in mind what we wrote about the current situation in the oil-to-gold ratio on Thursday:
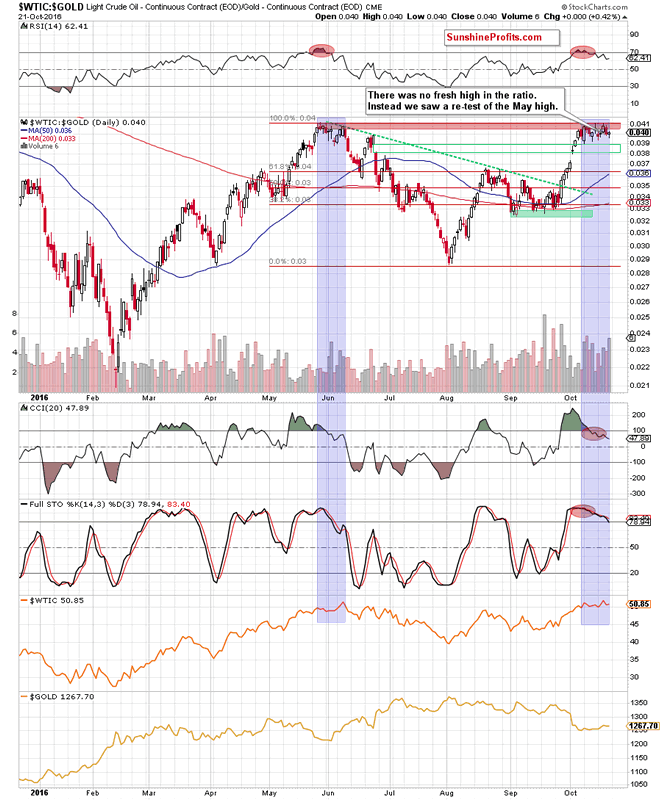
(...) although crude oil hit a fresh 2016 high, we didn’t see a similar price action in the case of the ratio. Instead, we saw a re-test of the May high, which means that we have a negative divegence between the commodity and the ratio.
What does it mean for crude oil’s future moves? As you see on the chart, we had a similar situation in May and Jun. Back then the ratio didn’t manage to hit a fresh high in line with crude oil, which translated into declines in both cases – crude oil and tthe ratio. Additionally, sell signals generated by the indicators remain in place, suggesting further deterioration in the ratio and lower prices of light crude as a strong negative correlation remains in place.
Finishing our today’s alert, we would also like to draw your attention to the relationship between crude oil and the general stock market.
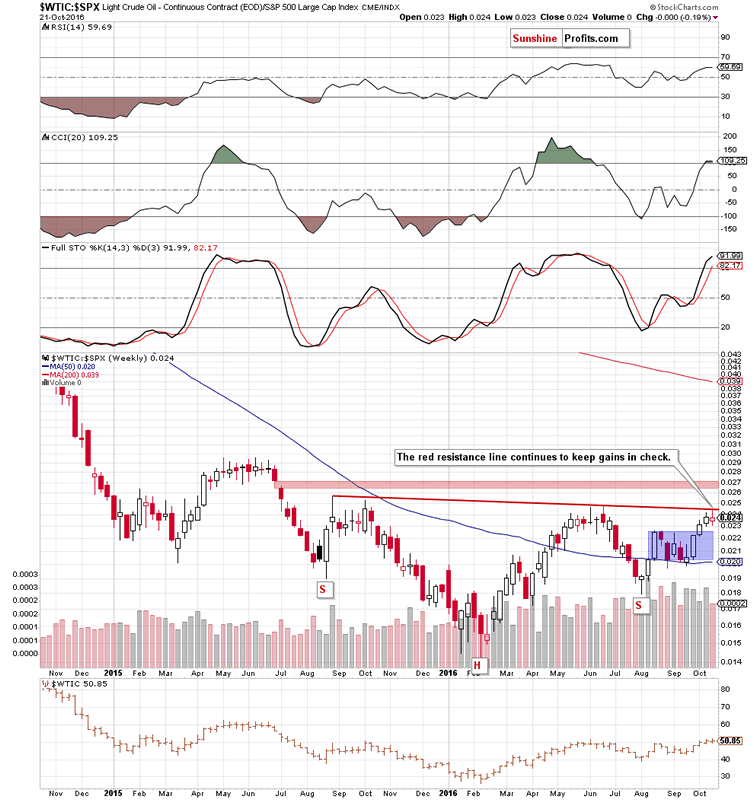
On the weekly chart, we see that although the ratio moved higher during the last week, the red resistance line (a neck line of a potential everse head and shoulders formation) stopped further improvement, triggerig a pullback. In our opinion, this means that as long as there won’t be a successful breakout above this line, another bigger move to the upside (in the case of the ratio and crude oil) is not likely to be seen.
On top of that, when we zoom in our picure and examine the daily chart we’ll see additionall bearish signals.
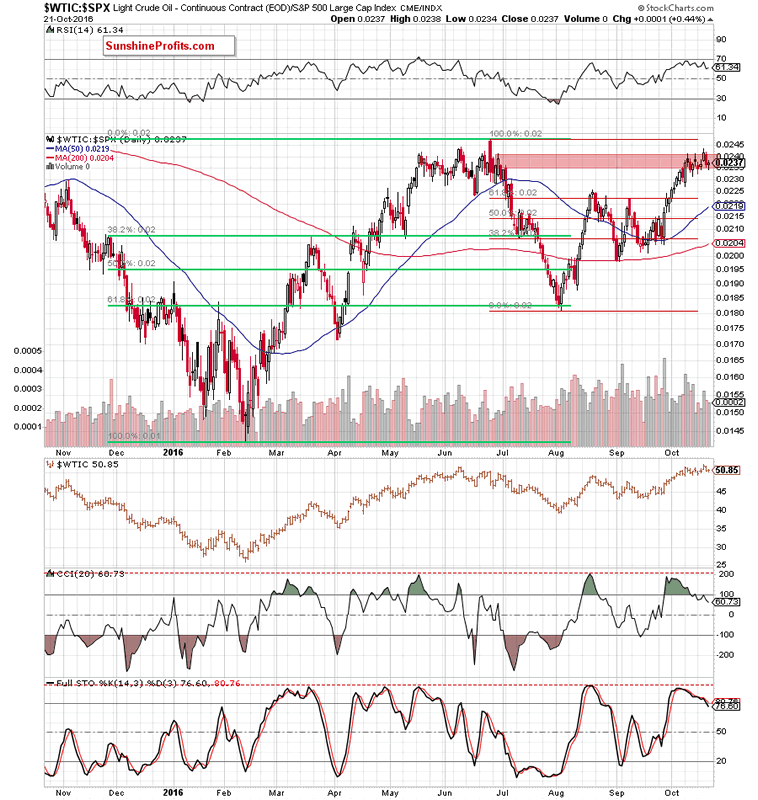
Firstly, similarly to what we wrote in the case of oil-to-gold ratio, the oil-to-stocks ratio didn’t hit a fresh 2016 high. Instead, we only saw an increase to the red resistanc zone based on the previous highs. Secondly, there were negative divergences between all indicators and the ratio, which resulted in generating signals sales (the CCI and Stochastic Oscillator).
Taking all the above into account, we believe that further deterioration in both ratios and crude oil is just around the corner. Therefore, another test of the barrier of $50 is more likely than not. If it is broken, the next downside taget would be around $49.15-$49.47, where the recent lows are.
Summing up, short positions continue to be justified from the risk/reward perspective as invalidation of breakouts and its negative impact on the price is still in effect. Additionally, sell signals generated by the indicators and the current situation in the above-mentioned ratios suggests further deterioration and a test of the first support area around $49.15-$49.47 in the coming day(s).
Very short-term outlook: bearish
Short-term outlook: mixed with bearish bias
MT outlook: mixed
LT outlook: mixed
Trading position (short-term; our opinion): Short positions (with a stop-loss order at $53.22 and initial downside target at $46) are justified from the risk/reward perspective.
As a reminder – “initial target price” means exactly that – an “initial” one, it’s not a price level at which we suggest closing positions. If this becomes the case (like it did in the previous trade) we will refer to these levels as levels of exit orders (exactly as we’ve done previously). Stop-loss levels, however, are naturally not “initial”, but something that, in our opinion, might be entered as an order.
Thank you.
Nadia Simmons
Forex & Oil Trading Strategist
Przemyslaw Radomski
Founder, Editor-in-chief
Sunshine Profits: Gold & Silver, Forex, Bitcoin, Crude Oil & Stocks
Stay updated: sign up for our free mailing list today
* * * * *
Disclaimer
All essays, research and information found above represent analyses and opinions of Nadia Simmons and Sunshine Profits' associates only. As such, it may prove wrong and be a subject to change without notice. Opinions and analyses were based on data available to authors of respective essays at the time of writing. Although the information provided above is based on careful research and sources that are believed to be accurate, Nadia Simmons and his associates do not guarantee the accuracy or thoroughness of the data or information reported. The opinions published above are neither an offer nor a recommendation to purchase or sell any securities. Nadia Simmons is not a Registered Securities Advisor. By reading Nadia Simmons’ reports you fully agree that he will not be held responsible or liable for any decisions you make regarding any information provided in these reports. Investing, trading and speculation in any financial markets may involve high risk of loss. Nadia Simmons, Sunshine Profits' employees and affiliates as well as members of their families may have a short or long position in any securities, including those mentioned in any of the reports or essays, and may make additional purchases and/or sales of those securities without notice.
© 2005-2022 http://www.MarketOracle.co.uk - The Market Oracle is a FREE Daily Financial Markets Analysis & Forecasting online publication.