


SPX Downtrend Should be Underway
Stock-Markets / Stock Markets 2016 Aug 27, 2016 - 03:07 PM GMTBy: The_Gold_Report

 The market started the week at SPX 2184. After a decline to SPX 2176 on Monday the market rallied to 2193. A pullback followed to SPX 2170 on Thursday, then a gap up opening on Friday, rally to 2188, selloff to 2160, then ended the week at 2169. For the week the SPX/DOW lost 0.75%, and the NDX/NAZ lost 0.40%. Economic reports for the week were mixed. On the downtick: existing home sales, Q2 GDP, consumer sentiment, and the Q3 GDP estimate. On the uptick: new home sales, the FHFA, durable goods orders, plus weekly jobless claims improved. Next week’s reports will be highlighted by monthly payrolls, ISM and the PCE. Best to your week!
LONG TERM: uptrend
The market continues to offer three basic long term counts, as we have been noting in recent weeks/months. Last week we gave the three counts an equal probability. After an additional week of watching the activity, and some improvement in the technicals, we are slightly raising the probability of one count and lowering the other two.
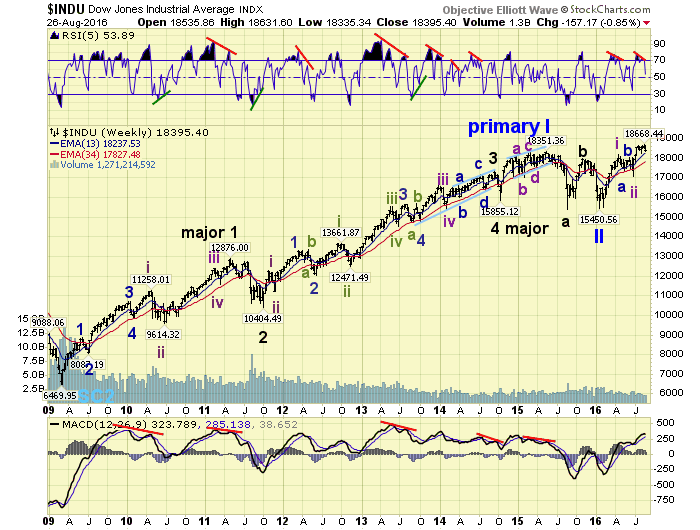
The count we favor is posted on the DOW charts and it is the new bull market Primary III scenario. We do not expect many to agree, but we are raising its probability to 40%. The count suggests the market has only completed Intermediate waves i and ii, and possibility Minor wave 1 of Int. iii at the recent all time high. Since Primary wave bull markets unfold in five Major waves, and we are in the early stages of Major wave 1, this long term trend has a long way to go.
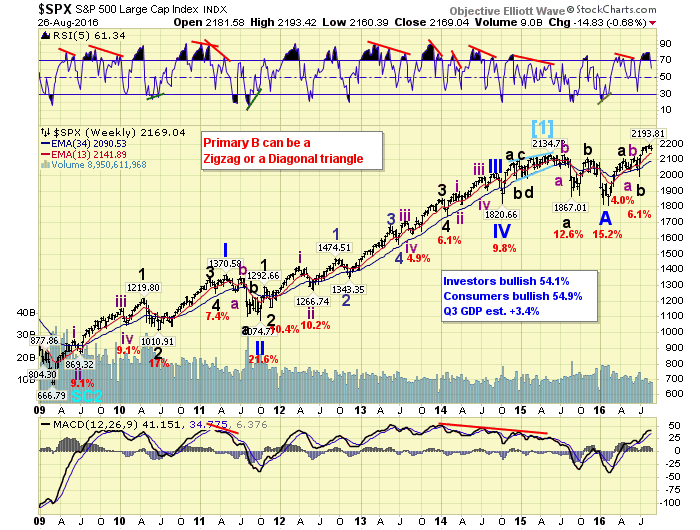
The second count we favor is posted on the SPX charts and is the one we started with: an irregular Primary wave B. This one may be a bit more popular, but we are lowering its probability to 30%. This count suggests the major indices (SPX/DOW/NDX/NAZ) are making new highs during an ongoing long term bear market. As the new highs are part of an irregular counter-trend rally within an overall long term downtrend. The maximum upside potential for this count is SPX 2336 (1.618 times Primary A). Anything beyond that and the count is eliminated.
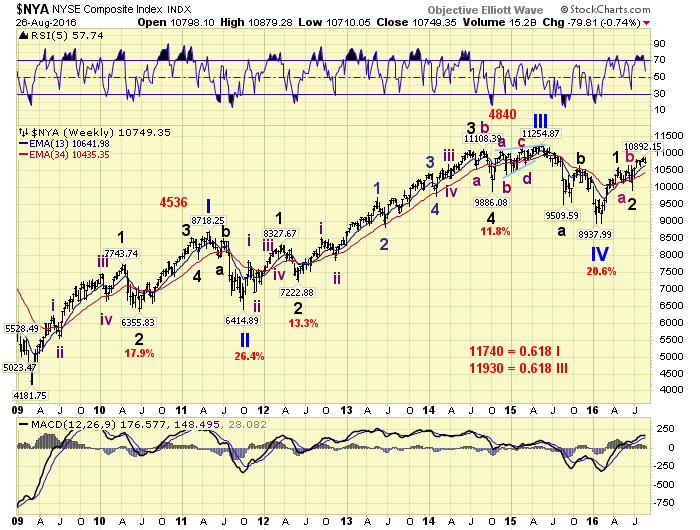
Our least favorite count is actually the most popular. It is posted on the NYSE charts and suggests the bull market from 2009 is still underway, and the market is currently in Primary V. We are giving this count a 30% probability as well. The current wave structure suggests Major waves 1 and 2 have completed, and Intermediate wave i of Major wave 3 may have topped at the recent high. This index, surprisingly, has not even made a new all time high yet. Even the Wilshire 5000 is outperforming the NYSE. We believe this due to its excess exposure to foreign stocks. Making it more of an international index than a US index.
MEDIUM TERM: uptrend may have topped
Since the trends of all US major indices generally follow each other, the remaining sections will be on the popular SPX. After the Br-exit low at SPX 1992 in late-June an uptrend was underway. We have been tracking this uptrend with five Intermediate waves: 2109-2074-2178-2148-2194. As it unfolded we noticed that wave iii (104 pts.) was shorter than wave i (117 pts.), which requires wave v to be shorter than both. Third waves cannot be the shortest. Thus far wave v is quite short compared to the other two: 46 pts. Less than half of wave iii.
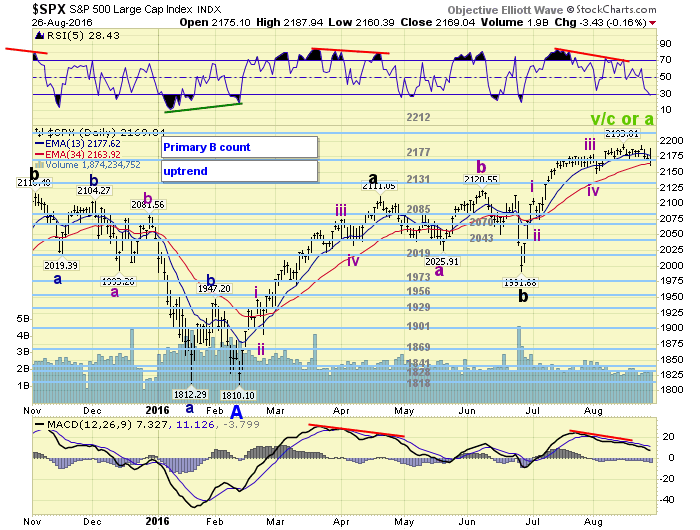
After the SPX 2194 high on August 16th the market became quite choppy, and entered a trading range between SPX 2169 and 2193. On Friday after a rally to SPX 2188 the market broke through the low end of the range, hitting 2160. This suggests, as expected, a downtrend has been underway. In fact, a downtrend confirmation is not too far away from current levels.
Since wave v was so small the likely downtrend support is not at wave iv, but between waves i and ii (SPX 2109-2074). Should the market correct that far, which is really only about 5%, the downtrend will have overlapped the previous uptrends in all the major indices. This overlap would help confirm the subdivisions noted in the DOW/NYSE counts in the long term section. For the SPX count, however, this creates a few more variables within the overall pattern of an irregular Primary B wave. We noted these variables on the daily chart. Medium term support is at the 2131 and 2085 pivots, with resistance at the 2177 and 2212 pivots.
SHORT TERM
From the potential uptrend high at SPX 2194 we can count a decline to 2169, a three wave rally to 2193, and now a three wave decline to 2160. This would suggest a small a wave at 2169, a small be wave at 2193, then a small c wave: 2170-2188-2160 so far. All of this activity is probably part of a larger a-b-c correction.
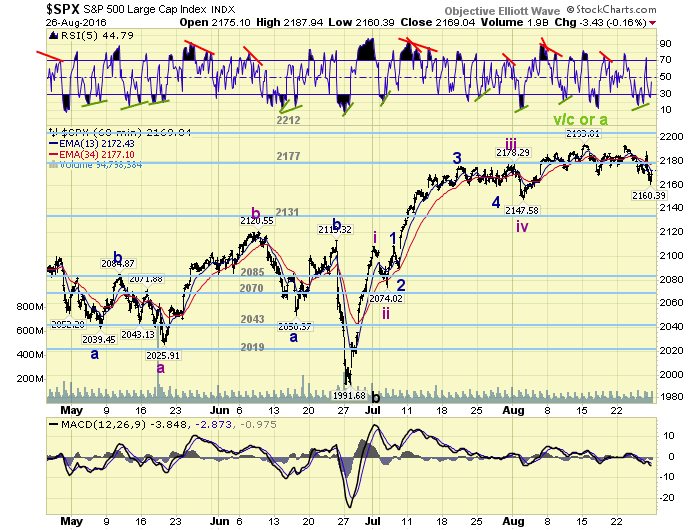
If we apply the normal Fibonacci retracements to the SPX 1992-2194 uptrend we arrive with the following support levels: 2117 (38.2%), 2093 (50%) and 2069 (61.8%). Since SPX 2117 is only a 3.5% correction it is not likely to hold support. The other two levels are more in line with moderate corrections of late: 4.6% and 5.7%. With pivots at 2085 and 2070 these two levels also fit quite well.
Short term support is at the 2131 and 2085 pivots, with resistance at the 2177 and 2212 pivots. Short term momentum ended the week just under neutral.
FOREIGN MARKETS
Asian markets were mostly lower on the week for a net loss of 0.7%.
European markets were nearly all higher for a net gain of 1.7%.
The commodity equity group were mixed for a net loss of 0.8%.
The DJ world index lost 0.8%.
COMMODITIES
Bonds remain in a downtrend and lost 0.5% on the week.
Crude appears to be in an uptrend but lost 3.0% on the week.
Gold appears to be in a downtrend and lost 1.5% on the week.
The USD is trying to uptrend and gained 1.0% on the week.
NEXT WEEK
Monday: personal income/spending and PCE prices at 8:30. Tuesday: Case-Shiller and consumer confidence. Wednesday: the ADP, Chicago PMI and pending home sales. Thursday: weekly jobless claims, construction spending, the ISM and auto sales. Friday: monthly payrolls (est. 190K), the trade deficit and factory orders.
CHARTS: http://stockcharts.com/public/1269446/tenpp
After about 40 years of investing in the markets one learns that the markets are constantly changing, not only in price, but in what drives the markets. In the 1960s, the Nifty Fifty were the leaders of the stock market. In the 1970s, stock selection using Technical Analysis was important, as the market stayed with a trading range for the entire decade. In the 1980s, the market finally broke out of it doldrums, as the DOW broke through 1100 in 1982, and launched the greatest bull market on record.
Sharing is an important aspect of a life. Over 100 people have joined our group, from all walks of life, covering twenty three countries across the globe. It's been the most fun I have ever had in the market. Sharing uncommon knowledge, with investors. In hope of aiding them in finding their financial independence.
Copyright © 2016 Tony Caldaro - All Rights Reserved Disclaimer: The above is a matter of opinion provided for general information purposes only and is not intended as investment advice. Information and analysis above are derived from sources and utilising methods believed to be reliable, but we cannot accept responsibility for any losses you may incur as a result of this analysis. Individuals should consult with their personal financial advisors.
Tony Caldaro Archive |
© 2005-2022 http://www.MarketOracle.co.uk - The Market Oracle is a FREE Daily Financial Markets Analysis & Forecasting online publication.