


Crude and the Commodity Cycle
Commodities / Crude Oil Aug 24, 2016 - 02:17 AM GMTBy: Tony_Caldaro

 Over the years we have written many times about the 34-year commodity cycle. Generally commodities rise as a group in a 13-year bull market, which is followed by a 21-year bear market. Each specific commodity has its own particular cycle which generally fits within the broader 34-year commodity cycle.
A bullish phase of this cycle started about two decades ago in 1998, and ended in 2011. A bear market, lasting about 21-years, has been underway since then. Sorry gold bugs! During the bull market phase some commodities rise in five waves. During the bear market phase all commodities decline in three larger waves. Naturally, just like there are corrections in bull markets, there are rallies in bear markets. Commodities, in general, are currently in one of those bear market rallies.
![]()
When one looks at a Crude chart covering nearly 50-years, one can clearly see two periods of rising prices and two periods of declining to sideways prices. While these rising and declining periods may look sporadic, they are actually quite regular when one knows what to look for. As we will explain in the following chart.
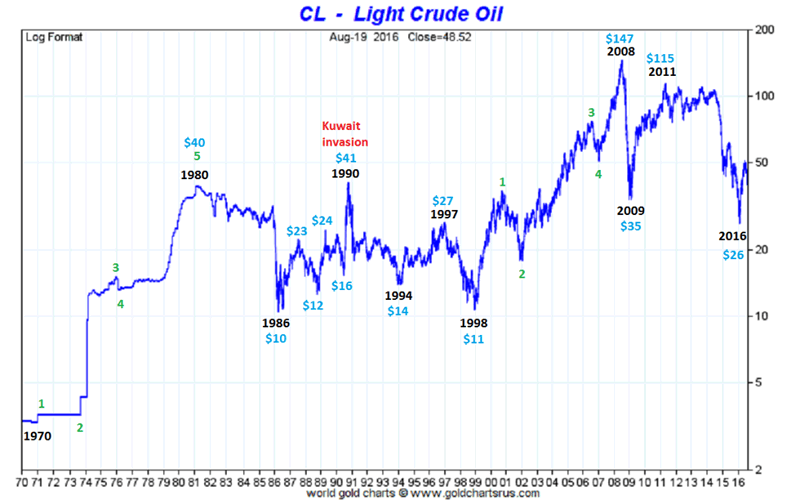
The two rising periods were actually five wave 10-year bull markets, i.e. 1970-1980 and 1998-2008. These two bull markets were separated by an 18-year bear market, i.e. 1980-1998. The rise during the bull markets were quite spectacular. Well over 1000% in such a short period of time. Price rises like these always lead to excess-capacity events. And these events are normally followed by nearly as spectacular declines. Which eventually cuts capacity until supply/demand reaches an equilibrium. We are in one of those equilibrium periods now.
With Crude 8-years into its bear market, and at least a decade away from starting a new bull market, we can already see a pattern unfolding which is relative to its previous bear market. To see this pattern one needs to review the larger waves first. During the last bear market Crude declined from 1980-1986, rallied to 1990, then declined from 1990-1998. A 6-year decline, then a 4-year rally, followed by an 8-year decline.
Since the current bear market just had an 8-year decline, 2008-2016, we should look into the last 8-year decline. Then the 8-year decline unfolded in three waves [1990]: 1994-1997-1998. Now the 8-year decline has also unfolded in three waves [2008]: 2009-2011-2016. Notice 1990: 4dn-3up-1dn, and 2008: 1dn-2up-5dn, nearly the exact reverse or mirror image. If we consider this a completed pattern, and we do, the next thing that should occur is a choppy 4-year bear market rally, i.e. 1986-1990 or 2016-2020. Therefore the $26 low should be the low for at least the next four years.
How far could Crude advance? During the last bear market all rallies, excluding the aberration from the Kuwait invasion, retraced 38.2%, 50.0%, or more of the previous larger decline. This suggests an upside target between $70 and $85 by the year 2020. Then, after that, a six-year decline into the final bear market low, which should be around the $26 area. In summary one should expect a price range between $25 and $85 over the next decade. Unless there is a supply-event, which could push the upper range higher.
CHARTS: http://stockcharts.com/public/1269446/tenpp
After about 40 years of investing in the markets one learns that the markets are constantly changing, not only in price, but in what drives the markets. In the 1960s, the Nifty Fifty were the leaders of the stock market. In the 1970s, stock selection using Technical Analysis was important, as the market stayed with a trading range for the entire decade. In the 1980s, the market finally broke out of it doldrums, as the DOW broke through 1100 in 1982, and launched the greatest bull market on record.
Sharing is an important aspect of a life. Over 100 people have joined our group, from all walks of life, covering twenty three countries across the globe. It's been the most fun I have ever had in the market. Sharing uncommon knowledge, with investors. In hope of aiding them in finding their financial independence.
Copyright © 2016 Tony Caldaro - All Rights Reserved Disclaimer: The above is a matter of opinion provided for general information purposes only and is not intended as investment advice. Information and analysis above are derived from sources and utilising methods believed to be reliable, but we cannot accept responsibility for any losses you may incur as a result of this analysis. Individuals should consult with their personal financial advisors.
Tony Caldaro Archive |
© 2005-2022 http://www.MarketOracle.co.uk - The Market Oracle is a FREE Daily Financial Markets Analysis & Forecasting online publication.