Nasdaq Short Opportunity
Stock-Markets / Tech Stocks Aug 21, 2016 - 05:32 PM GMTNasdaq Weekly Chart with Fib. Spiral @ Week 34
Many traders are frustrated with the current market, sideways to slow melt up process. I will reserve some info. for paid subscribers only. Arguments can be made for the Bull's or Bear's but honestly the bottom line is to make money, period. Money is all that matters, that IS the bottom line.
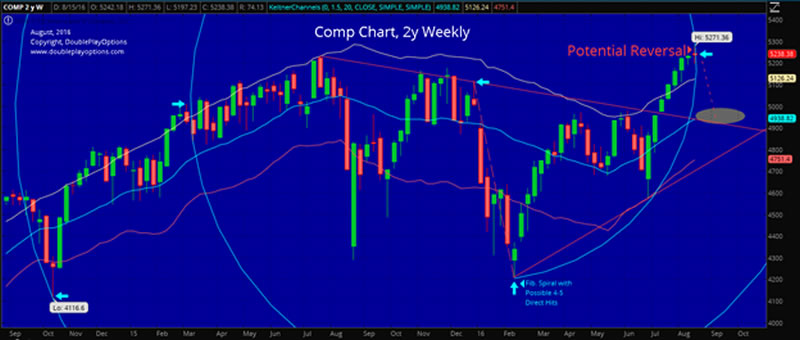
Below is a current chart of the Nasdaq Composite, using weekly candlesticks. Note the breakout and upcoming backtest.
The chart shows a fib. spiral with arrows, a weekly doji with a close lower then the open, and higher high then previous week, lastly two trendlines making a triangle. The top resistance trendline is now acting as support, this may become important.
I almost forgot to mention the Keltner Channels, clearly showing support at the mid-band, coinciding with the triangle support.
The potential dates have to be reserved for subs, along with price projections. If you are long the market, this is a great place to tighten your stops. Website, is currently offering a free month for a limited time.

Joseph VanDerveer is the Chief Technical Analyst with 8 years experience in the trenches trading the markets with a brand new website and service at www.doubleplayoptions.com
© 2016 Copyright Joseph VanDerveer - All Rights Reserved
Disclaimer: The above is a matter of opinion provided for general information purposes only and is not intended as investment advice. Information and analysis above are derived from sources and utilising methods believed to be reliable, but we cannot accept responsibility for any losses you may incur as a result of this analysis. Individuals should consult with their personal financial advisors.
© 2005-2022 http://www.MarketOracle.co.uk - The Market Oracle is a FREE Daily Financial Markets Analysis & Forecasting online publication.


