


Wake Up and Smell the Stocks Bull Trap!
Stock-Markets / Stock Markets 2016 Aug 10, 2016 - 12:05 PM GMTBy: Chris_Vermeulen

 We are currently experiencing a “Kondratiev Winter” stage in this stock market which is at its’ “tipping” point. This is where nominal to incremental highs on the SPX can be exceeded by 2%, but, by no more than 4%. I am observing a “MARKET FAILURE” right here and now. This is a BULL TRAP!
Last Fridays’, August 5th, 2016 rally in the SPX big price move, on low volume, resulted in no trend change to the larger BEARISH patterns. It does not change the Bearish pattern, but it probably does mean that the current rally will last for at least a few more days. There are multiple times in which rallies are reversed during the early part of the following week after a strong jobs report.
Both investors and traders continue to throw money at stocks every time that there is any hint of “manufactured” good news. The majority of stocks, on the NYSE, are still in ‘downtrends’. Last Friday, August 5th, 2016, the Bureau of Labor Statistics released their “bogus” jobs report claiming that 255,000 new jobs were created.
This strong number caused gold to drop sharply, which momentum traders could have profited handsomely if they knew about the rouge price spikes taking place in gold just hours before the move.
The labor participation rate rose a mere 0.2 percent to 62.8 percent which is at a 40 year low. This means that potentially over 90 million Americans are still not working.
After adding only 11,000 jobs, in May of 2016, the Bureau of Labor Statistics would have the public believe that the US has now added over 550,000 jobs, in the sixty-day period, since. I find these numbers still hard to believe. There is no actual evidence of this having occurred:
It is all just a statistical adjustment as well as the “seasonal adjustment” factor as mentioned by Zero Hedge.
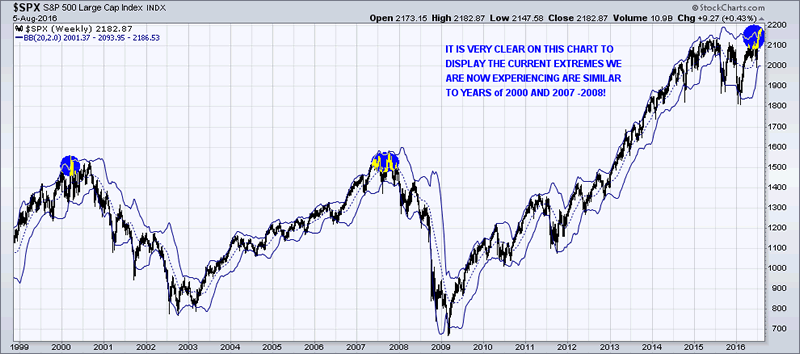
Over the past 120 years, within in a 7-year bull market, it is during the Fall season of the 7th year when the next major decline commences. The SPX is putting in its’ final TOP. It will become a well-defined top that usually cannot exceed a 2% to 4% throw over.
We are currently witnessing an extremely aged and overvalued bull market. The SPX Index, despite the exuberance of “record highs,” is just 2% above its’ May 2015 peak. The SPX has pushed it to its’ most extreme overvalued, overbought and over bullish syndrome in an environment where momentum is slowly rolling over. Whether one is bullish or bearish, one needs to recognize that any current extremes are “unparalleled”.
Statistically speaking, the single most probable outcome is actually a small gain which we have experienced and which is then followed by abrupt and severe losses that can have the potential of wiping out weeks or even months of upside progress with an unexpected and rapid decline.
I will have to wait for the market sentiment to shift toward “risk-aversion”, before participating in any long-term bearish ETF trades. Within an increased global systematic world, both investors and traders are making “risky and unparalleled” bets, these days.
I can visualize the financial meltdown. Many financial entities will have lower profits since low interest rates persist. Historically, low yields squeeze the net interest income of banks and make liabilities harder to meet for insurance companies. I would cut their EPS forecasts by 5%-7%. The fall in Treasury yields explains most of the cut. Their strong headwind is headed our way.
Sell into These Rallies: If you are still in the stock market, I continue to recommend to sell stock positions into the rallies.
Chart End of July 31st, 2016
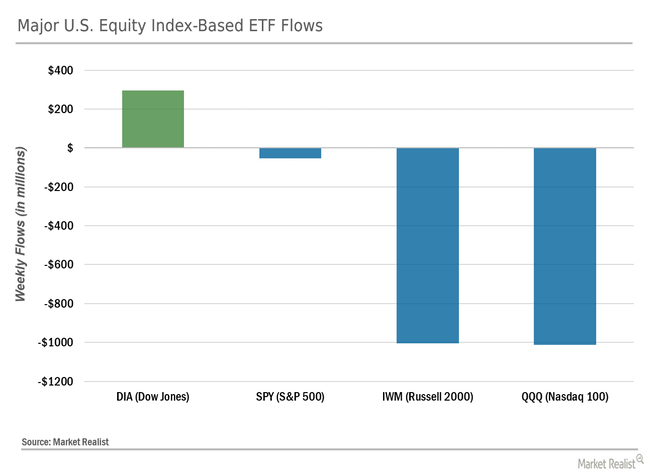
Take a look at the stock index outflows in July. This shows money continues to leave the leading indicator stocks (Russel 2k, and the Nasdaq).
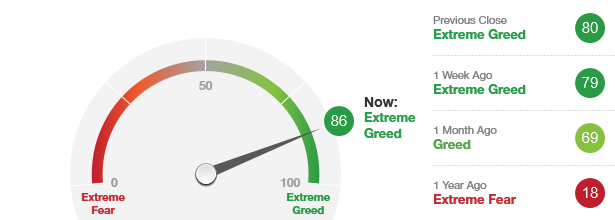
CNN Chart of Fear and Greed August 6th, 2016
Now, take a look at the fear index. While I personally use a slightly different mix of indicators to measure market sentiment, this is very close to my calculation and shows it in a simple visual format.
Conclusion:
With all of the “Extreme” complacently and the “Extreme” greed in the stock market, it is the perfect storm for DISASTER!
With that said, nothing happens exactly when it should in the stock market. The market is constantly trying to get the mass of participants on the wrong side of the market. If it doesn’t shake you out, it will wait you out and I feel it’s doing the later method now.
Huge opportunities are just around the corner for both swing trades and long-term ETF investment positions that shoot up in value sooner than later, which I will share with my readers.
Get my analysis and trades at: www.TheGoldAndOilGuy.com
Join my email list FREE and get my next article which I will show you about a major opportunity in bonds and a rate spike – www.GoldAndOilGuy.com
Chris Vermeulen is Founder of the popular trading site TheGoldAndOilGuy.com. There he shares his highly successful, low-risk trading method. For 7 years Chris has been a leader in teaching others to skillfully trade in gold, oil, and silver in both bull and bear markets. Subscribers to his service depend on Chris' uniquely consistent investment opportunities that carry exceptionally low risk and high return.
Disclaimer: Nothing in this report should be construed as a solicitation to buy or sell any securities mentioned. Technical Traders Ltd., its owners and the author of this report are not registered broker-dealers or financial advisors. Before investing in any securities, you should consult with your financial advisor and a registered broker-dealer. Never make an investment based solely on what you read in an online or printed report, including this report, especially if the investment involves a small, thinly-traded company that isn’t well known. Technical Traders Ltd. and the author of this report has been paid by Cardiff Energy Corp. In addition, the author owns shares of Cardiff Energy Corp. and would also benefit from volume and price appreciation of its stock. The information provided here within should not be construed as a financial analysis but rather as an advertisement. The author’s views and opinions regarding the companies featured in reports are his own views and are based on information that he has researched independently and has received, which the author assumes to be reliable. Technical Traders Ltd. and the author of this report do not guarantee the accuracy, completeness, or usefulness of any content of this report, nor its fitness for any particular purpose. Lastly, the author does not guarantee that any of the companies mentioned in the reports will perform as expected, and any comparisons made to other companies may not be valid or come into effect.
Chris Vermeulen Archive |
© 2005-2022 http://www.MarketOracle.co.uk - The Market Oracle is a FREE Daily Financial Markets Analysis & Forecasting online publication.