


More on the ‘Breadth Thrust’ and Stock Market Internals
Stock-Markets / Stock Markets 2016 Jul 19, 2016 - 12:09 PM GMTBy: Gary_Tanashian

 NFTRH 404 deviated from the usual format of widespread, in-depth coverage of US and global markets, precious metals and commodities in order to focus on two main themes. One was a view of building short-term risks in the gold market [possibly pending new rally highs] and the other of a developing bullish phase in the US stock market. We reproduce part of that segment here…
Ref. Breadth Thrust: Prelude to a Crash?(July 12)
Subscriber ‘LN’ presented a view of the impending ‘breadth thrust’ signal and we both came to the same conclusion; that this is ending action in the stock market. It is at once very bullish and very bearish, depending on time frames. Below is additional information per ‘LN’, who is a financial adviser and thus, not a casual observer. I would also note that both ‘LN’ and I have similar caveats about analogs from the past projecting to the future (they often do not do it well). But for reference (emphasis mine)…
“I went back and looked at 1987 a little closer. I know the price action isn’t going to be identical but I wanted to see if they rhyme at all.
From the thrust on 1/14/87 stocks went higher for 2 months without much in the way of pullbacks. Only about 2% a couple of times. I looked at the Dow and SPX and they are about the same. I have a feeling the Dow was more important back then.
Dow rallied 16% into March 26. Spx 15%. Then it started getting volatile. They declined 4 % in about a week and then rallied to a slightly higher high before an 8% correction. It didn’t break out again until June.
From the thrust day in 87 gold declined 7% and silver 5%, bottoming about a month after the thrust around February 18. From February 18 until around May 19 gold was up 23% and silver 75%!
The gold/silver ratio was 74 on the day of the thrust and was 50 on May 15.
Oil declined about 14% from the thrust through February. It then rallied 35% to a peak in July.
DXY was 100 on the thrust day and corrected 5% to 95 on May 4. It rallied back to 101 in August. So basically flat.
So maybe we head higher until mid September when the elections get hot and heavy. The market gets volatile and then breaks out again after the elections.
Gold and silver would bottom in about a month and rip higher from mid August up to the elections. Looking at a gold seasonality chart it appears to top in mid July and bottom late July to early August before ripping higher into October/November.
All of this seems to be setting up similar to 87.
I’ll be keeping a close eye on this.”
Even a mania has got to have some form of fundamental backing, whether real or imagined. In 1999 it was a story about the ‘.com’ rise vs. brick and mortar. Funny thing is that Amazon has proven the essence and vision of that story to be true, but there was so much hype and so many garbage companies built into it at the time that it could only fail.
Today’s mania, which I think the herd is just getting wind of, is that Brexit did not end the world, policy makers are looking to inflate (often competitively) at all costs and as we have been projecting for many weeks now, the US economy is not bad at all relative to expectations and perceptions of the majority.
Let’s look at some economic and market internals, beginning at the beginning, which for us was the trend in Semiconductor Equipment. For newer subscribers, here is the most recent data for bookings, billings and book-to-bill for Semiconductor manufacturing and processing equipment (as supplied by companies like Applied Materials, Lam Research, MKS Instruments, Brooks Automation, etc.).
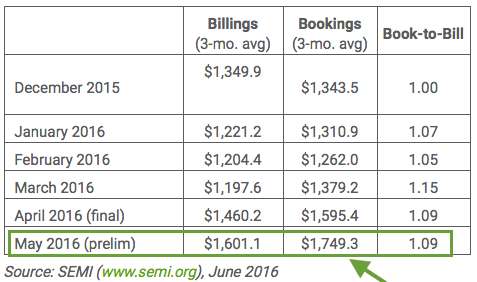
The book-to-bill is not what is important for our purposes; the bookings are the key forward looker. The positive trend began in March and the next data release is on July 21. I for one will be very interested in it because this was our first inkling that the building negativity on the US economy was looking the wrong way (backward).
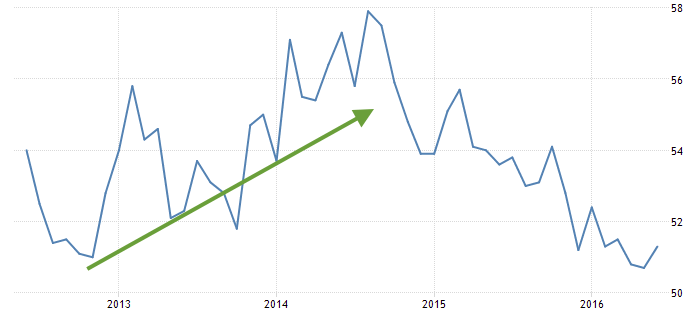
In Q4 2012 (we picked up on it in January 2013) Semi led the view of an oncoming economic bounce and then wouldn’t you know, general manufacturing improved as well. This graph of the Markit Manufacturing PMI from Tradingeconomics.com shows how manufacturing improved until the market began to get turbulent in 2014.
This is a good time to note that the positives we are discussing are short-term cyclical in nature. The growth manifests in spurts, which fits not only the above analog describing a short-term bull phase and eventual unwinding, but also is a commentary on volatile, erratic, policy-driven economies. It is not in any way organic, it is engineered.
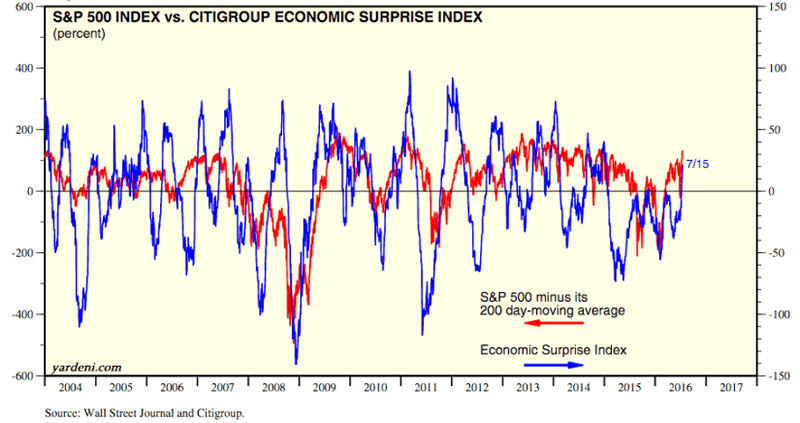
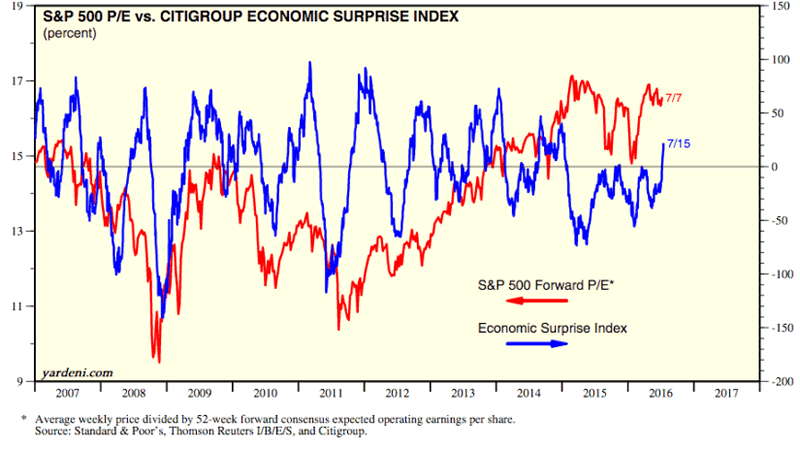
Moving on, economic data continue to be a mixed bag, but have started to improve lately, as we expected would be the case. From Yardeni.com per the noted sources, here are a couple of views of the ‘Economic Surprise’ index with the S&P 500’s price and P/E. This is another view stating that those who have been predicting gloom in the face of recent market turbulence have been playing last year’s game. The thing about surprises is that they are only surprises for those depending only on backward looking data.
Transitioning from economic to market signals, let’s look at recent developments in the Investors Intelligence data. The trend followers in the newsletter writer community have finally begun to get back on the bullish bandwagon as bulls climbed back above 50% for the first time since early 2015. The ‘correction camp’ shows a plunge in those expecting or positioned for a correction. Investors Intelligence is one data point in support of the view that markets can take a short-term negative reaction at any time now.
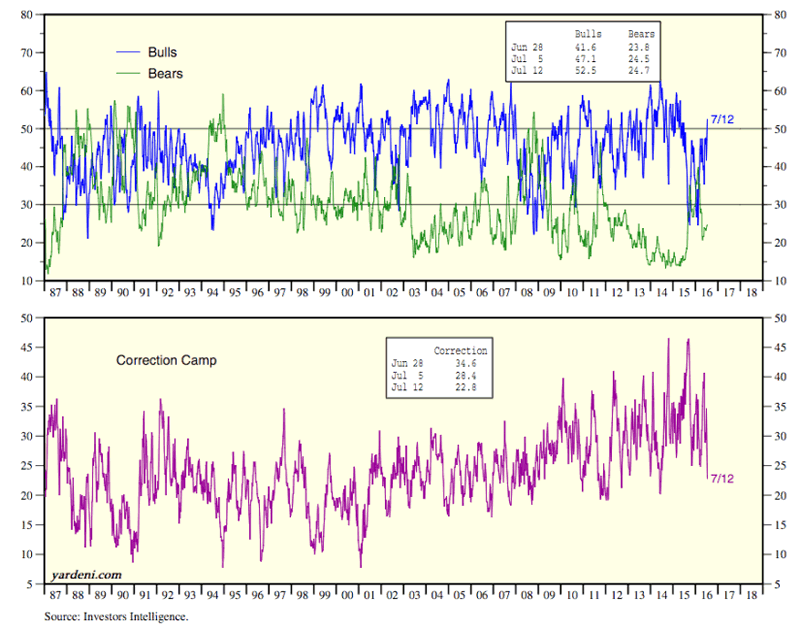
But beyond the short-term, the view remains flat out bullish. Beyond the intermediate-term? These are the policy stoked modern financial markets and I do not have a positive view beyond the intermediate-term. Too many distortions and variables.
Circling back to the ‘breadth thrust’ discussion, this is simply a picture of increasing market participation both in breadth and in volume. It is almost as if today’s casino patrons are finally saying to themselves, after Brexit failed to bring on the financial Armageddon that it seemed a majority expected, ‘nothing can kill this beast’.
In other words, it’s a capitulation of the bears. Without healthy levels of shorting, a market can get very bullish (especially amidst short covering) but in losing the grind of bearish participation, markets only know one way, up. That would be a final suck in of Mom, Pop and various other holdouts who just cannot take it anymore, after watching the bulls remain impervious to negative events, time after time after time.
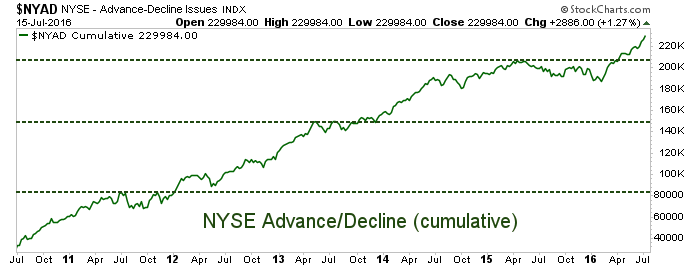
The NYSE Advance/Decline is shown as a bullish indicator at the bottom of the standard multi-index broad market chart each week. Let’s blow it up a bit and review. NYAD consolidated in 2011 and broke upward. It did the same in 2013. In 2016, after an extended and grinding bearish phase in the markets, it once again broke upward. This has acted as a bullish forebear to the ‘breadth thrust’ story that is now gaining traction.
<end excerpt>
This very detailed segment went on to review Participation indexes, New Highs/New Lows and more developments in the market sentiment backdrop. We also wrapped up with a clear ‘bottom line’ view of what is in play now from short, intermediate and long-term perspectives. We’ll have to clip the public post here but I do want to include a key chart (the S&P 500 weekly) that we have used for months now to gauge bull potential after the previous bear signal was negated.
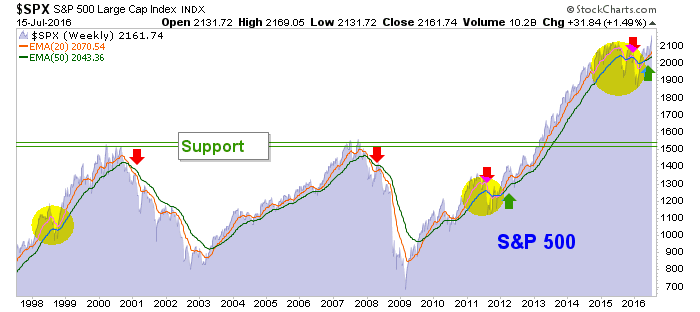
Part of the analysis that accompanied the chart…
“You can see a near cross of the moving averages in 1998 in reaction to those events [Long-Term Capital & Asian Contagion]. Dial ahead 12+ years and you can see our ‘2011 comp’, which did cross the moving averages down before whipsawing them back up. The 2011 market activity looks remarkably similar to 1998 and today’s up turned moving average condition is similar to 2011.”
Subscribe to NFTRH Premium for your 25-35 page weekly report, interim updates (including Key ETF charts) and NFTRH+ chart and trade ideas or the free eLetter for an introduction to our work. Or simply keep up to date with plenty of public content at NFTRH.com and Biiwii.com.
By Gary Tanashian
© 2016 Copyright Gary Tanashian - All Rights Reserved
Disclaimer: The above is a matter of opinion provided for general information purposes only and is not intended as investment advice. Information and analysis above are derived from sources and utilising methods believed to be reliable, but we cannot accept responsibility for any losses you may incur as a result of this analysis. Individuals should consult with their personal financial advisors.
Gary Tanashian Archive |
© 2005-2022 http://www.MarketOracle.co.uk - The Market Oracle is a FREE Daily Financial Markets Analysis & Forecasting online publication.