


New Stock Market Highs Correlate to $57 Trillion in Printed Global Currency Units
Stock-Markets / Stock Markets 2016 Jul 14, 2016 - 09:58 AM GMTBy: The_Gold_Report

 Precious metals expert Michael Ballanger discusses the relationship of rising money velocity, money printing and new stock market highs.
When people use the term "money," it usually refers to a unit of currency used in the transacting of business and commerce. A woman works cleaning houses for a week and gets paid in a number of currency units and then goes to the supermarket and exchanges those units for food or diapers or medicine. What is left over at the end of the pay period is called "savings," which are allowed to accumulate receiving a modest rate of interest. Around the globe this weekend, a vast number of banks are offering negative returns on savings, such that keeping one's accumulated units of currency in the bank is penalized. The objective of this monetary experiment is to combat the global problem of deflation. Despite $57 trillion of new currency units having been printed since the 2009 financial crisis, global growth has been tepid at best because the velocity of "money" has remained moribund and since all collateral underpinning this massive global debt must not be allowed to depreciate, the central banks have been allowed to engage in a massive, coordinated reflation designed to jumpstart "money" velocity.
The problem with this experiment is that it benefits really only one class of people—the Super Elite—and it impoverishes and in fact destroys the Middle and Working Classes, as rising living costs are not matched with rising wages nor increased wealth. Whereas the S&P 500 danced with its all-time high on Friday, that milestone means zero to the young college graduate diving into the workforce with $100,000 in student loans and a stock portfolio worth zero nor to the 50-something laborer approaching retirement years with no pension and no stock portfolio. The S&P at 2,150 has all of the CNBC crowd clinking champagne flutes and taking bows, but wasn't the first move to 2,134 in May of 2015? Since then, earnings have not grown one iota, which means that P/E multiples are expanding to dangerous levels inferring that the only thing driving the market is the constantly increasing number of currency units chasing a finite number of publicly traded companies. "Never underestimate the replacement power of stocks within an inflationary spiral" goes the old adage from the late 70s, which means that people "of means" benefit because they have been able to earn (or inherit) enough to afford a portfolio of common stocks that becomes more and more valuable with each currency unit printed.
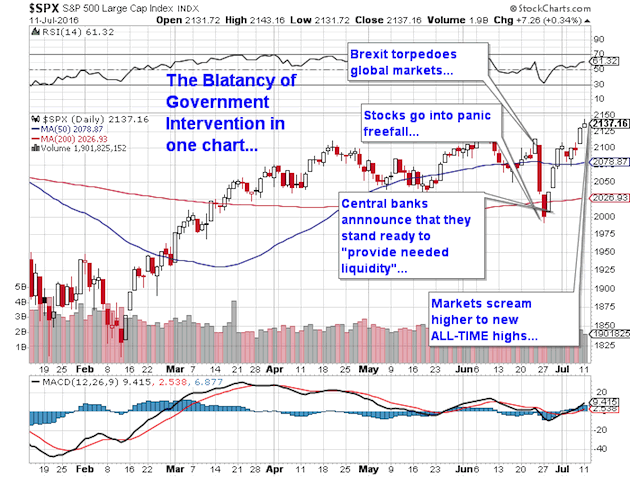
The average family around the globe in countries adhering to and practicing The Great Keynesian Experiment are not terribly thrilled with rising food, health care, and basic living costs while the 1% elite class celebrate. While the advent of even greater stimulus efforts such as the Bank of Japan's announcement last Sunday evening of a ¥10 TRILLION injection are creating dislocations across every asset class and in every country on the planet, the arrival of social unrest in major metropolitan centres such as London and Berlin and Stockholm are going to be the cracks that ultimately undermine the recent (totally bogus) post-Brexit recovery in stocks and bonds that was the function of a massive, synchronized series of market interventions spearheaded and orchestrated by global central banks that has taken on aspects of the Theatre of the Absurd.
I came home from a weekend in Indian Harbour, a gorgeous little inlet that we boaters have grown to love because it completely shelters us from the ravages of big wind and crashing waves that blast the other side of the island a mere fifteen meters from where we are anchored. Right beside the navigation screen is a my "marine quote screen" that picks up a satellite signal anywhere so that I'm able to delight myself watching these incessant government interventions no matter where I am. You will all recall the trade I put on in 2015 as the "2015 Trade of the Year" (shown below) where I shorted the SPY and bought the GLD in equal amounts in late 2014? Well it was a standout until the end of January until the "fix" was put in when interventions rescued the S&P and torpedoed gold and silver and ended up the year well below the levels at which we entered the trade. This year, however, it has been a huge favorite with the long/short managers and up until this week has been a massive winner.
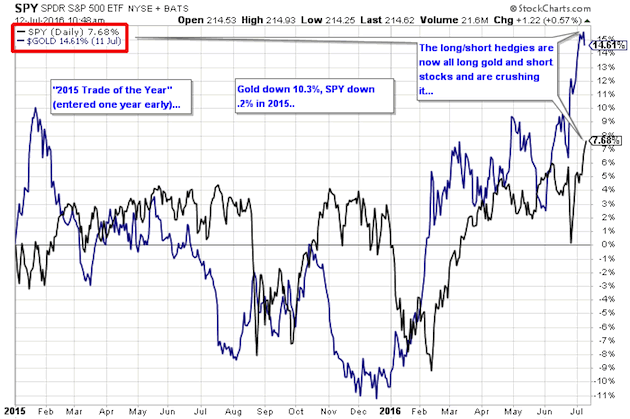
Stocks versus Gold January 2015 until Current
Now we take a look at the same chart only with a term of "Year to date" and we see just how URGENT it is for the banks to find a way to force profit-taking in the metals and speaking of that, just HOW does a Central Planner accomplish that? Well, you know that many of the "Large Speculators" are playing the "Long gold/Short S&P500" pair and based on the massive increases in open interest, they are now massively long with the bullion bank buffoons matching up with an equally massive short position. Thus far, the banks have thrown the proverbial kitchen sink at the Large Specs to try to create a liquidation panic in order to cover but have as of yet been unsuccessful. Furthermore, since Brexit, they doubled down on the trade highlighting the "Long Gold/Short Eurozone stocks" and as of this morning are drastically under water thanks to the interventions designed to keep the Eurozone banks (think Deutsche Bank) afloat. Now, all they have to do is keep this perpetual bid into the S&P, the FTSE and the DAX and the margin pressure is going to build against the "Long Gold/Short SPY" trade until finally the Large Spec hedgies are forced to hit the UNWIND button. The chart below displays an enormous outperformance for gold since the beginning of 2016 but you have to remember that any portfolio manager fails to nail down a 21% advantage over the competition (and in fact lets it slide away) will find himself out of a job in very short order. This is precisely the Achilles Heel of the current gold rally; its success year-to-date could quite conceivably be its own downfall.
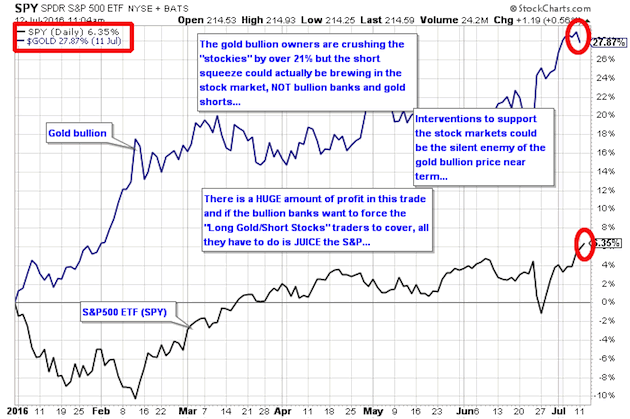
Stocks versus Gold 2016 Year-to-Date
The set-up is like something out of a Hollywood movie only this time it isn't "Mr. Deeds Goes to Washington" but rather "Mr. Bernanke Goes to Tokyo," where the mere mention of that 10 TRILLION YEN stimulus takes the dollar-yen screaming higher and stocks dutifully follow. The 2016 golden screenplay should be following "The Treasure of the Sierra Madre" format but instead it is more like "One Flew Over the Cuckoo's Nest" with every Champagne Socialist politician in the world clamoring to get us back to the "good ol' days" of galloping stock prices and deflating metals prices amidst this plethora of central bank cheerleading and price management. It is dead wrong and is starting to be seen for what it is—monetary policy designed for the exclusive benefit if the Super Elite in ALL countries around the globe the result of which will be an ever-increasing volley of Brexit-style anti-establishment referendums and populist revolts.
Final note: Amidst the current pullback in gold (of which I spoke and acted on last week), it is noteworthy that the Gold-to-Silver-Ratio ("GTSR") which I shorted in very late March above 82 has made a new low for the move at 65.76, generating a 19.80% profit in 112 days. Additionally, the 357 Magnum Portfolio, introduced on April 30th in this humble missive is now up 30.62% since April 30th.
I am also looking to short the S&P 500 and add to the UVXY under $7 perhaps as early as this afternoon. The CNBC crowd are now chortling over the Dow's record high today thinking, of course, that it is the "masterful handling of the Brexit Crisis" that has allowed markets to levitate, but if they took the time to remove their rose-colored Ray Bans, they would see the criminal interventions and manipulations for what they are—a travesty of free market principles. Despite the smiling faces of Simon Knobs or Jim Cramer, we had the same amount of glee in May of 2015 when the S&P hit all-time highs only to get smoked in the late summer of that year.
Protect your precious metals profits as best you can; it is back to the dartboard for me.
Originally trained during the inflationary 1970s, Michael Ballanger is a graduate of Saint Louis University where he earned a Bachelor of Science in finance and a Bachelor of Art in marketing before completing post-graduate work at the Wharton School of Finance. With more than 30 years of experience as a junior mining and exploration specialist, as well as a solid background in corporate finance, Ballanger's adherence to the concept of "Hard Assets" allows him to focus the practice on selecting opportunities in the global resource sector with emphasis on the precious metals exploration and development sector. Ballanger takes great pleasure in visiting mineral properties around the globe in the never-ending hunt for early-stage opportunities.
Disclosure:
1) Statements and opinions expressed are the opinions of Michael Ballanger and not of Streetwise Reports or its officers. Michael Ballanger is wholly responsible for the validity of the statements. Streetwise Reports was not involved in any aspect of the article preparation or editing so the author could speak independently about the sector. Michael Ballanger was not paid by Streetwise Reports LLC for this article. Streetwise Reports was not paid by the author to publish or syndicate this article.
2) This article does not constitute investment advice. Each reader is encouraged to consult with his or her individual financial professional and any action a reader takes as a result of information presented here is his or her own responsibility. By opening this page, each reader accepts and agrees to Streetwise Reports' terms of use and full legal disclaimer. This article is not a solicitation for investment. Streetwise Reports does not render general or specific investment advice and the information on Streetwise Reports should not be considered a recommendation to buy or sell any security. Streetwise Reports does not endorse or recommend the business, products, services or securities of any company mentioned on Streetwise Reports.
3) From time to time, Streetwise Reports LLC and its directors, officers, employees or members of their families, as well as persons interviewed for articles and interviews on the site, may have a long or short position in securities mentioned. Directors, officers, employees or members of their families are prohibited from making purchases and/or sales of those securities in the open market or otherwise during the up-to-four-week interval from the time of the interview until after it publishes.
All charts courtesy of Michael Ballanger.
© 2005-2022 http://www.MarketOracle.co.uk - The Market Oracle is a FREE Daily Financial Markets Analysis & Forecasting online publication.