


The Stock Market is Reading it Wrong!
Stock-Markets / Stock Markets 2016 Jul 02, 2016 - 06:24 PM GMTBy: Chris_Vermeulen

 The European markets, the British pound, and Euro had rallied for six days prior to its’ meeting based on political polls. These polls were showing that the vote was too close to call. The market incorrectly interpreted this as meaning that the “Remain” side would prevail. The British pound hit a new a year-to-date high last Thursday, June 23rd, 2016, the day of the election. Banks had done especially well in the rally, some being up by almost double digits during their best days. After the Brexit vote, they experienced a massive ‘selloff’.
I prepared my readers in advance of “BREXIT”
Right now, everything is still rebalancing from the “Brexit” vote. The “mass media” will talk about how it will affect the Eurozone and its’ impact on the world for the remainder of this week. The experts will blame “BREXIT” for this decline, but that is only ‘the symptom’.
I sent a ‘trade alert’ to my subscribers on June 8th, 2016 to enter the long position of gold, using the most liquid and most traded ETF, “GLD”, and on “Black Friday” our position was up 5%. Another ‘flash alert’ was sent out on June 9th, 2016 to enter the long position of U.S. twenty year bonds, using the most liquid and most traded ETF for U.S. Bonds, “TLT”, and our position is deep in profits also.
Most hedge funds and money managers experienced heavy losses because they tend to be much more heavily weighted in equities.
As small traders and investors we can be much nimbler and are not forced to hold various positions in equities like most funds. Knowing that we have an added ‘edge’ and if you follow my lead ETF alerts my strategies can help keep you on the right side of all the markets.
Over the next 3 to 5 years, I will present very ‘unique’ opportunities to not only protect your wealth, but to grow your trading account handsomely using my “Cycle Analysis” and my “Predictive Analytics Models”
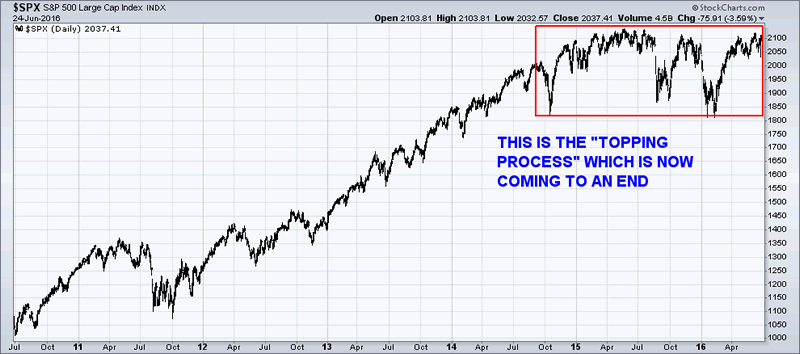
The SPX could not break out of its’ resistance ‘zone’. It has not been able to get through for over a year and a half and this is typical of a ‘long-term topping pattern’.
This week stocks have rallied huge. Why? It could be for many reasons like: end of month window dressing by the institutions, pre-holiday rally, the market was oversold earlier in the week so a bounce should be expected.
A new Sell Signal is on the rise for stocks. If this is the outcome, then it should continue to sell off down to 1830 level over the next 30 days.
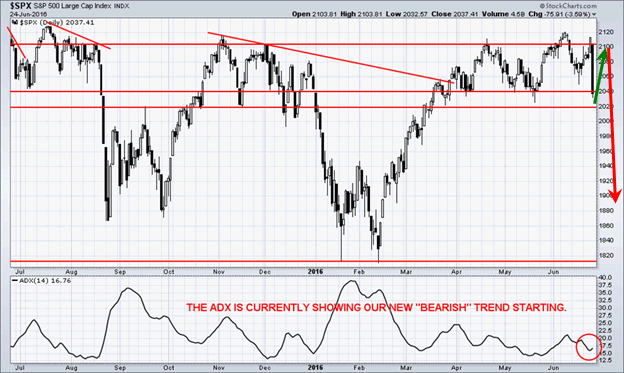
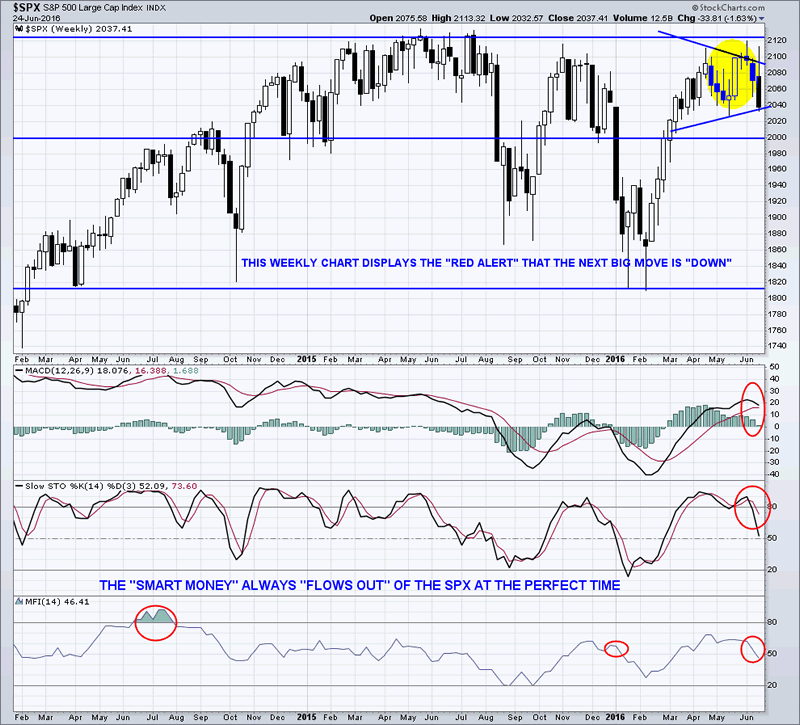
This should look very similar to the ‘sell off’ that occurred back in August 2015. The selling pressure drove the SPX to previous support. In this area, it is a reasonable location for support to now show up. The SPX has not broken out of the established channel over the last few months. On the weekly chart of the SPX there is also channel starting at 2000 up to 2100. Momentum oscillators on the weekly chart suggest the beginning of the channel rollover.
The Only Chart You Needed to See:
The Bullish Percent Index (BPI) is a breadth indicator based on the number of stocks on Point & Figure buy/sell signals within an index. The index is either on a P&F buy or sell signal, there is no ambiguity when it comes to this chart reading. This makes The Bullish Percent Index (BPI) fluctuates between 0% and 100%.
Bear Alert: BPI is above 70% and then declines below 70%.

Concluding Thoughts:
Expect greater volatility because of uncertainty regarding the “bearish sentiment” along with lower prices starting early next week.
Get My ETF Trade Alerts Here: www.TheGoldAndOilGuy.com
Chris Vermeulen
Join my email list FREE and get my next article which I will show you about a major opportunity in bonds and a rate spike – www.GoldAndOilGuy.com
Chris Vermeulen is Founder of the popular trading site TheGoldAndOilGuy.com. There he shares his highly successful, low-risk trading method. For 7 years Chris has been a leader in teaching others to skillfully trade in gold, oil, and silver in both bull and bear markets. Subscribers to his service depend on Chris' uniquely consistent investment opportunities that carry exceptionally low risk and high return.
Disclaimer: Nothing in this report should be construed as a solicitation to buy or sell any securities mentioned. Technical Traders Ltd., its owners and the author of this report are not registered broker-dealers or financial advisors. Before investing in any securities, you should consult with your financial advisor and a registered broker-dealer. Never make an investment based solely on what you read in an online or printed report, including this report, especially if the investment involves a small, thinly-traded company that isn’t well known. Technical Traders Ltd. and the author of this report has been paid by Cardiff Energy Corp. In addition, the author owns shares of Cardiff Energy Corp. and would also benefit from volume and price appreciation of its stock. The information provided here within should not be construed as a financial analysis but rather as an advertisement. The author’s views and opinions regarding the companies featured in reports are his own views and are based on information that he has researched independently and has received, which the author assumes to be reliable. Technical Traders Ltd. and the author of this report do not guarantee the accuracy, completeness, or usefulness of any content of this report, nor its fitness for any particular purpose. Lastly, the author does not guarantee that any of the companies mentioned in the reports will perform as expected, and any comparisons made to other companies may not be valid or come into effect.
Chris Vermeulen Archive |
© 2005-2022 http://www.MarketOracle.co.uk - The Market Oracle is a FREE Daily Financial Markets Analysis & Forecasting online publication.
Comments
|
Trader_MC
02 Jul 16, 20:32 |
Hindsight?
Hmmmm, charts dated 24th June posted on 2nd July? Hindsight comes to mind ;) |