


The Insanity of Rising Crude Oil AND Gold Prices
Commodities / Resources Investing Jul 22, 2008 - 04:23 AM GMTBy: Brian_Bloom

 One characteristic of the charts is that they show patterns which demand attention, regardless of any preconceptions or prejudices one might have.
I have been writing fairly extensively recently about a psychological phenomenon known as “cognitive dissonance” which – broadly speaking – means that a healthy mind cannot comfortably hold two conflicting thoughts simultaneously. Typically what happens if one has a fairly well entrenched view on any subject, and a piece of conflicting evidence manifests, is that one either rejects the new evidence as being “obviously” (?) wrong, refuses to acknowledge its existence, or rationalises it away as being unimportant.
There are many who are firmly convinced that the US Dollar has no future. Well, the chart below should set up some cognitive dissonance for those particular people (Chart courtesy stockcharts.com )
It is a ratio of the US$ Index to the Gold Price
As a technical analyst, the message of this chart – which hit me like a brick in the face – was “Something is seriously out of balance. The ratio is too far from its trend line”.
Strictly speaking, this chart is due for a strong bounce – back up towards the falling trend line. Yes, it might continue heading south thereafter, but it would have to go into free fall at this point if the double bottom were to be penetrated on the downside. From a fundamental perspective, that would imply a collapsing (world) financial system.
Could it collapse? Of course, anything is possible, but the balance of probabilities calls for a strong technical reaction upwards. Either the US$ Index must bounce up strongly, or the gold price must pull back strongly.
Now, those who believe the US Dollar is toast will be feeling significant cognitive dissonance as a result of this last observation. Alternatively, those who believe that the gold price is about to explode into the stratosphere will be feeling significant cognitive dissonance. Some (in both camps) will even be angry with me personally for delivering such a message. Some will be thinking very unkind thoughts about my capabilities, my sanity, my professionalism, my judgement, you name it. That's a normal reaction when a well entrenched belief is challenged; and the reader should recognise that it is not this analyst that is throwing out any challenges. All I am doing is pointing out that the ratio of the US$:$Gold has fallen extraordinarily far away from its trend line. There is no purpose to be served in attacking the messenger.
How does one cope with cognitive dissonance?
In simple terms, one steps back and examines the evidence with a fresh eye and without a prejudicial viewpoint.
Imagine you were not an owner of gold or gold shares, and/or you were not short up to your eyeballs of the US Dollar, how would you view the chart below – which is a ratio of the $HUI to the Gold Price? (Chart courtesy Stockcharts.com)
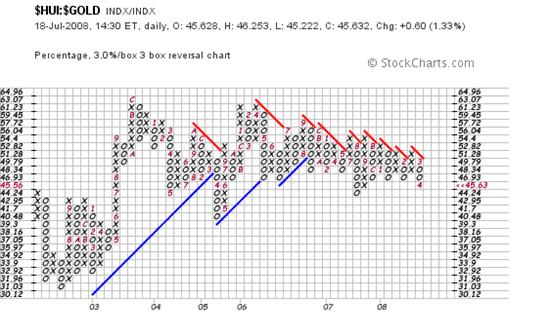
Oops! See that little number “4” at the bottom right hand corner? See how it has reached a level which is lower that the previous three zeros (bottoms) that sit at the same level in the six boxes to the left. Technically, that is called a “sell” signal. It doesn't always follow that a sell signal is correct. If it was that easy, we would all be basking on the Riviera.
In strict and unemotional terms, it is possible (and I emphasise that word “possible”) for the ratio to fall as low as 37. That would bring the $HUI back to the same level it was relative to the gold price in 2003.
So now we have to face one of those classical dilemmas: Are we traders in gold or are we investors in gold? If we are traders, the charts are pointing to a “possible” 50% rise in the US$:$Gold ratio, and a “possible” 18% fall in the $HUI relative to a (falling?) gold price.
Let's reduce this to numbers:
Assuming the US$ index was 100 and stayed there; and assuming the gold price was also 100. The gold price would have to fall to 50. Assume that the $HUI, for the purposes of this discussion, also started at 100.
If the HUI fell by 18% relative to gold which, in turn, fell 50% relative to the US$, it would have to fall to 41. This would imply a 59% fall from its current level.
Is that possible, according to the chart of the $HUI?
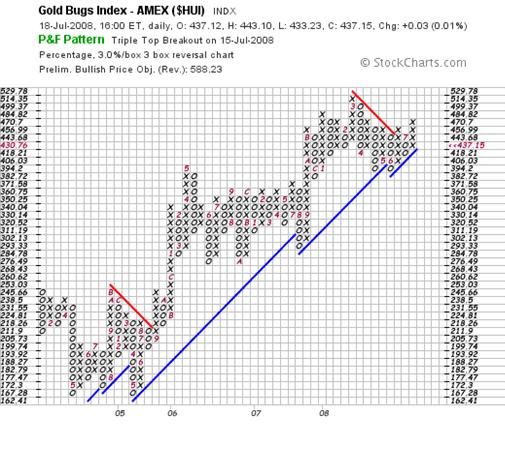
As it happens, this chart is at a very sensitive juncture. It gave a “buy” signal on July 15 th , but pulled back to the price prevailing before the buy signal. The $HUI is now sitting right on a rising trend line. If the level of 418 is penetrated on the downside, the horizontal count destination would be 293 – which is roughly 30% below current levels.
Looking at the $HUI from a different perspective (courtesy Decisionpoint.com). This is a strong chart, in that it appears to have broken up through the third fan line of a fan formation – but there is a question mark hanging over it because the price is now back below the third fan line.
Could the gold price pull back?
Well, the short terms charts (and, arguably, the above two chart) are extremely bullish. The daily chart of gold has just broken up out of a three line fan formation, and has not pulled back below the third fan line. But, as I have been arguing for many months now, because everyone and his brother is now a chartist, I don't trust short term charts.
Let's have a look at the monthly chart of gold. (Courtesy Decisionpoint.com)
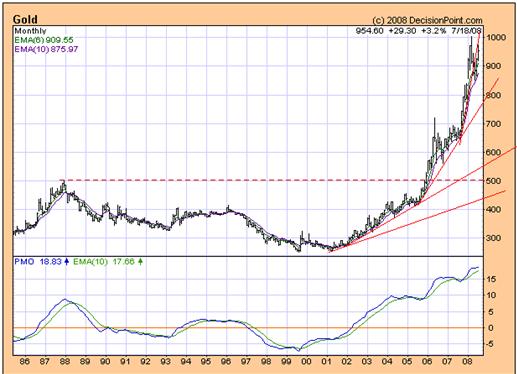
There are two worrying aspects about this chart.
- There is an uncovered “gap” at around $840. If that gap represents a breakaway gap, then it will not be covered, and the gold price will likely scream upwards as the cracks in the world economy show and investors panic into gold (which is an argument that resonates with many gold phile investors and which is also, presumably, why the daily charts are so strong).
- The PMO Oscillator is at an extraordinarily high level – where it might stay if the world economy starts to unravel, as many commentators are beginning to believe.
And this brings us back to the concept of cognitive dissonance. We have arrived at a juncture in history where we all (bulls, bears and fence sitters) have to reassess and re-evaluate our primary thought paradigms.
If we genuinely believe that the world economy is about to fall in a heap, then we will have to reject the above “evidence” that the markets may have reached extremes. (To be crystal clear, the short term evidence supports the view that gold is going to rise and the dollar is going to fall; but the longer – medium – term charts cast considerable doubt on this view.)
It is probably appropriate to disclose my personal situation at this juncture.
I have owned gold shares since 1999. Had I bought and held, the original investment would have been 600% higher. Along the way, I switched a few times and made one bad mistake. As a result of this mistake, the capital value of my gold shares is only 4X the original amount. At that time I bought gold shares as an insurance policy. I remain wedded to gold as an insurance policy, but have come to understand that gold is fundamentally extremely valuable - because it has some unique physical properties which I have known about in principle for some years, and which science has begun to validate in the past year or so. I am therefore a long term bull on gold and will be a holder for the long term.
The truth is that no-one can tell what the future holds and the people who have been making money using charts and computer generated signals, need to look in the mirror and do some soul searching. Understand that, if you are betting against the dollar and your money is on gold (in the short term) you are betting that the world economy is about to fall over the edge of the precipice.
If you seriously think that the world economy is about to tank, then the very first chart above will defy all historical logic and will continue to travel south – because we will be facing a very ugly scenario.
On the other hand, if you think (like I do) that the oil price at $130 a barrel defies all logic given that synthetic diesel can be manufactured from coal at less than $50 a barrel, then you will have to ask yourself: “Just how much damage can we allow these sycophant politicians to wreak on society before we kick them out of office?”
The reason the world has allowed the oil price to rise to $130 a barrel is that we have “bought into” the IPCC's argument, initiated by Margaret Thatcher and book-ended by Al Gore, that Carbon Dioxide emitted into our atmosphere has the capacity to destroy our environment. The political agenda since Thatcher's days has been to shift from fossil fuels to Nuclear Fission. If that can be accomplished then the existing political power structure can be entrenched. The strong will remain strong and the weak will remain weak; and I am not talking conspiracies. My argument flows from pure logic. If your objective is to maintain the political power status quo as between countries then embracing nuclear fission energy is a sound strategic argument because it can legitimately be withheld from the weaker countries. It just happens to be a morally indefensible argument and is also technically flawed in context that nuclear is a far worse pollutant than CO2.
Let's be very clear. It is self evident that rising CO2 levels within the environment are certainly undesirable, and have certainly exacerbated global warming – that has been caused by our unusually active sun . But the evidence is mounting that there is no way that rising CO2 levels could possibly have caused our oceans to warm in such a short period of time, or the ice caps on Mars to melt, and/or one or two other disconnects in logic which are also causing the IPCC scientists and their followers to suffer from cognitive dissonance.
The Ice Caps on Mars are melting? Ah let's just ignore that one shall we? It doesn't fit neatly into our argument. We don't know what the water vapour levels in the atmosphere were at the start of the Industrial Revolution? Of well, let's sweep that one under the carpet too. Forget about the fact that water vapour is 3-4 times as powerful a greenhouse gas as CO2. It makes a better story to argue that CO2 is causing Global Warming. Sorry, Mr Gore, the Science is not settled, and the louder you shout that particular statement, the less I trust you. You can fool all of the people some of the time, and some of the people all of the time. But you can't fool all of the people all of the time.
Now, what will happen if the market suddenly gets hit by an ice-cold bath of reality – that oil at $130 a barrel makes no sense at all, and probably arose from speculative behaviour of technical analysts and their computer programs riding on a wave of fear of imminent demise of our environment - fomented by the politicians – because of CO2 emissions?
As an aside, I invite the reader to think very carefully about the following:
Australia – which has abundant coal reserves – seems extraordinarily reluctant to embrace Fischer Tropsch technology to convert coal to synthetic diesel (at less than $50 a barrel) because this would aggravate CO2 emissions. Sensible? Maybe.
Why maybe? Because Australia also appears to have no compunction in exporting as much coal to China and/or anyone else who might be prepared to buy it. Personally, I am experiencing significant cognitive dissonance about that particular set of conflicting circumstances.
Let's have a look at the long term chart of oil, courtesy Decisionpoint.com.
Look at the position of the PMO oscillator and ask yourself these questions:
“If the world economy is about to collapse – evidenced by a collapsing US Dollar and a skyrocketing gold price as investors panic into gold, why would the oil price also skyrocket? Surely, in an environment of a collapsing world economy, the oil price would collapse?”
Are you experiencing yet more cognitive dissonance? How could both of these scenarios be true? Clearly, they cannot. It therefore follows that one of them is wrong.
But if the US$ does not tank, and the gold price does not rise to the stratosphere (yet), then surely this would be evidence that the world economy is not about to tank? And, if this is the case, then why would the oil price stay at these levels – particularly given that we have a whole bunch of alternative energies coming down the turnpike?
The reader is invited to have a look at the following video which talks about an oil “end game”.
http://www.ted.com/index.php/ talks/amory_lovins_on_winning_ the_oil_endgame.html
It is being argued on this video that, not only is oil overpriced in current dollars, it was overpriced when the video was made in 2005.
No, dear reader, I'm afraid that our “real” problem is the inappropriate calibre of people whom we have elected into positions of political power. The issue devolves to “eligibility” as opposed to “competence”. Politics is the only profession in the world where practitioners do not have to pass any “eligibility” tests. We vote for the most plausible, charismatic, silver tongued salesmen, regardless of their personal eligibility.
A long as we keep doing that, nothing is going to change.
By Brian Bloom
The definition of insanity is when you keep doing the same things over and over again and yet you expect a different outcome. We need to change our perspective on life. We need to start managing our affairs differently. It was in the hope of stimulating discussion regarding this particular issue that I sat down to write Beyond Neanderthal in October 2005. It has now been published and may be purchased at www.beyondneanderthal.com .
Copyright © 2008 Brian Bloom - All Rights Reserved
Disclaimer: The above is a matter of opinion provided for general information purposes only and is not intended as investment advice. Information and analysis above are derived from sources and utilising methods believed to be reliable, but we cannot accept responsibility for any losses you may incur as a result of this analysis. Individuals should consult with their personal financial advisors.
Brian Bloom Archive |
© 2005-2022 http://www.MarketOracle.co.uk - The Market Oracle is a FREE Daily Financial Markets Analysis & Forecasting online publication.