


Agri-Commodities Winning in 2016
Commodities / Agricultural Commodities Jun 09, 2016 - 01:51 PM GMTBy: Ned_W_Schmidt

 The inevitable just seems to keep coming around. That over time food would become scarcer in our world has been well known for decades. Simply put, global demand for food continues to expand. Inevitable scarcity of food for the world is occasionally hidden by short-term bursts of exceptionally good harvests. But, exceptionally good is not a normal state for world's Agri-Food production.
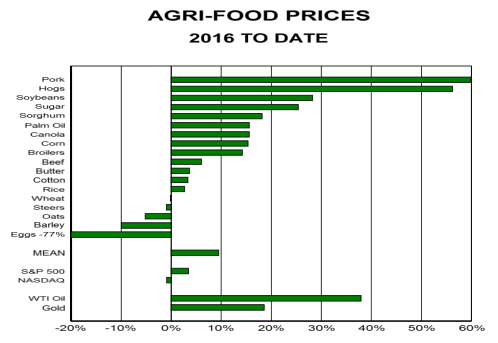
Above chart is the 2016 year-to-date percentage price change for each of 18 Agri-Commodities valued in U.S. dollars. For much of the past year farmers have suffering financially from inadequate prices for their production. In 2016, that situation is apparently changing. Simply put, a stash of soybeans or sugar in the bowl on your table have outperformed equity markets. As can be observed in the lower part of chart, the average(mean) gain thus far is almost ten percent.
A number of Agri-Commodities have recently hit new 52-week highs. US cash corn joined that elite club yesterday. These higher prices are being driven by growing demand and inadequate production. Soybean prices are a good example of this situation. USDA estimates that the U.S. will only have 28 days of consumption in reserves at end of 2017 crop year, 31 August 2017. (Note: Using crop years, not calendar years.)
Agri-commodities
Recent
New 52-week Highs
US Cash Corn
US Cash Soybeans
US$ Cotton
US$ World Sugar
US$ Pork
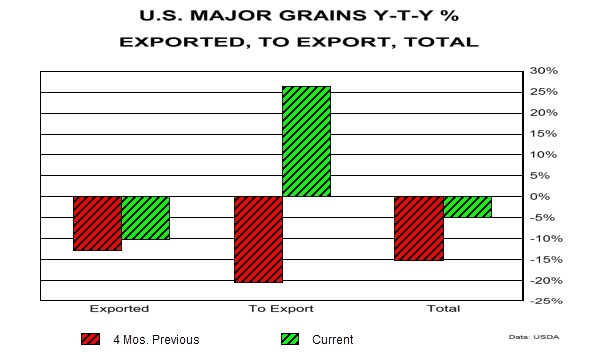
Expanding global demand for Agri-Commodities is now evident in U.S. grain exports. In above chart are plotted year-to-year percentage changes for U.S. major grain exports. Green bars are current value while red bars are for four months ago. Middle set of bars, To Export, are export sales made but not yet exported. Four months ago those export sales were down 20% from previous year. More recently those export sales were up 25%. That is clear evidence of stronger global demand and the benefits of a depreciating dollar.
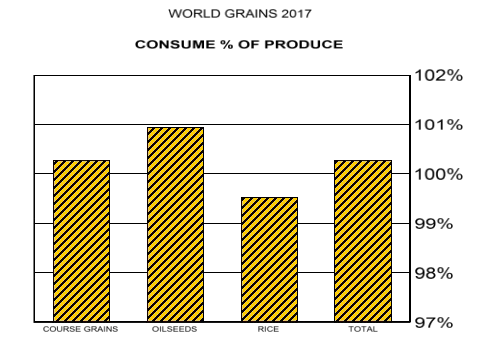
In bottom chart is plotted consumption as a percent of production for the three major grain groups. Starting from left is course grains, basically all grains except oilseeds and rice, oilseeds, largely soybeans, and rice. As both are over 100%, world will consume more than that produced for both course grains and oilseeds in the coming crop year. If world consumes more than it produces, prices will rise. Note that in this data we use crop years, rather than calendar years. 2017 crop year starts June-September and ends in May-August 2017.
Situation in Agri-Commodities has already benefitted investors thus far this year, and is likely to continue to do so. Tier One Agri-Equities are up roughly11% thus far in 2016. That return compares quite favorable to small positive return for S&P 500 and NASDAQ Composite being down.
By Ned W Schmidt CFA, CEBS
Ned W. Schmidt,CFA has had for decades a mission to save investors from the regular financial crises created by economists and politicians. He is publisher of The Value View Gold Report, monthly, with companion Trading Thoughts. To receive these reports, go to: www.valueviewgoldreport.com Follow us @vvgoldreport
Copyright © 2016 Ned W. Schmidt - All Rights Reserved
Ned W Schmidt Archive |
© 2005-2022 http://www.MarketOracle.co.uk - The Market Oracle is a FREE Daily Financial Markets Analysis & Forecasting online publication.