


The Next Big Crash Of The U.S. Economy Is Coming, Here’s Why
Economics / Economic Collapse May 27, 2016 - 10:12 AM GMTBy: Steve_St_Angelo

 Investors better be prepared as the next crash of the U.S. economy is coming. This is not based on hype or speculation, rather due to the disintegration of the underlying fundamentals. Matter-a-fact, the fundamentals are so completely AWFUL, that the next market crash will make 2008 look quite tame indeed.
To get the skinny on the lousy fundamental data, let’s first look at the Auto Industry. The next series of charts come from the article, More Warnings–Unsustainable Auto Sales & Stock PE Ratios:
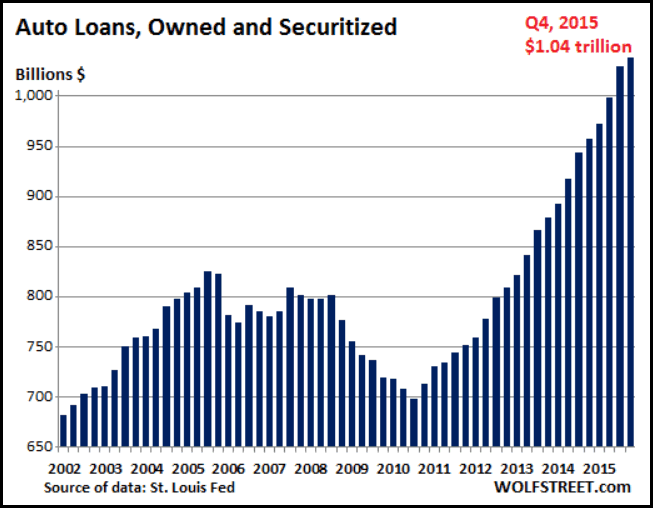
Ever since the supposed economic turnaround, the amount of outstanding auto loans has increased dramatically from less that $700 billion in 2010 to over $1 trillion in the fourth quarter of 2015. According to Wolf Richter, quoted in the article:
“Deep-subprime borrowers are high-risk. Typically they have credit scores below 550. To make it worth everyone’s while, they get stuffed into loans often with interest rates above 20%. To make payments even remotely possible at these rates, terms are often stretched to 84 months. Borrowers are typically upside down in their vehicle: the negative equity of their trade-in, along with title, taxes, and license fees, and a hefty dealer profit are rolled into the loan. When the lender repossesses the vehicle, losses add up in a hurry.
When I was younger, the longest automobile loan an individual could get was 48 months. However, you were considered to be a REAL LOSER if you had to finance an automobile that long. Now, 84 months is becoming the norm….LOL.
This is just one factor that shows just how weak the economy has become if Americans have to finance a car for seven years.
Here is another chart from the article linked above. It shows just how inflated the S&P 500 index has become:
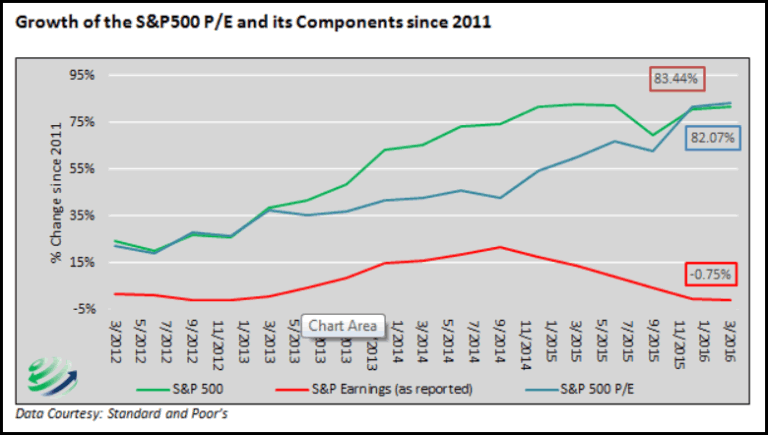
According to Michael Lebowitz of 720 Global Research (quoted in the article):
Since October 1, 2011, the S&P 500 has risen 82% on the heels of a 0.75% decline in earnings. The price to earnings ratio over that time period has risen 83%, with price gains contributing 99% to the increase. Prices have risen substantially, while earnings have actually fallen. The chart below highlights the growing gap between earnings and the S&P 500.”
As we can see from the chart, the S &P 500 and earnings have been surviving on HOT AIR, especially since the latter part of 2014. When QE (money printing) and zero interest rates no longer provided enough bounce in the markets, the Fed, Central Banks and the Plunge Protection Team stepped in a BIG WAY to keep the markets from crashing.
So, not only do we have a highly over-leveraged automobile financed industry, the broader stock market valuations are in bubble territory. Unfortunately, this is only part of the story. If we look at the disintegrating U.S. Energy Industry, the situation is even more dire.
The Coming Collapse Of The U.S. Energy Industry
Today I did an interview with Money Metals Exchange. I will be putting out the interview when it’s published. However, I discussed this energy subject matter during the interview. When I first started the interview, I said the precious metals community was guilty of propagating hype and short-term surging price moves that never came true. Thus, we have frustrated a lot of precious metals investors because the COLLAPSE of the Dollar, DEFAULT of the COMEX or much HIGHER gold and silver prices have not yet occurred.
So, am I guilty myself by putting out a new a headline that reads, “The Coming Collapse of the U.S. Energy Industry?” No…. here’s why.
The situation in the U.S. Energy Industry is so AWFUL, I wouldn’t be surprised to see half of the industry go bankrupt over the next few years. Of course, the U.S. Government could step in and either bail out or nationalize the energy industry, but this would stop the impending collapse.
Let’s take a look at this next chart. The U.S. Energy Industry has added so much debt that it took nearly half of all its operating profits to just pay the interest on its debt in 2015:
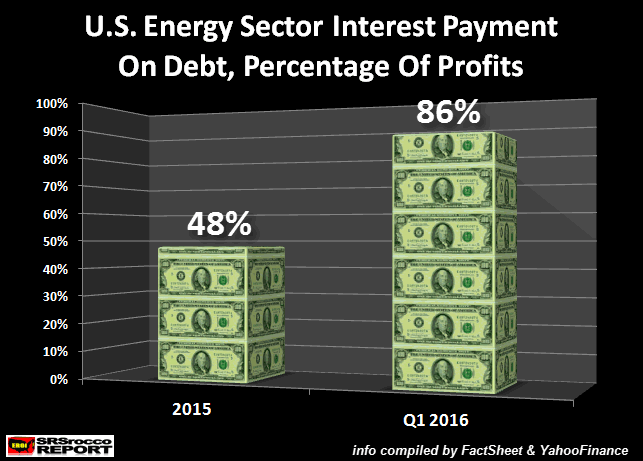
While this was bad, it was even worse in the first quarter of 2016. According to the article, Why Oil & Gas Companies Are Barely Scraping By, the U.S. Energy Sector paid 86% of its total profits just to service the interest on its debt. Can you imagine that?
This chart from the article shows the huge change of interest payments on debt of the percentage of operating income in the U.S. Energy Sector:
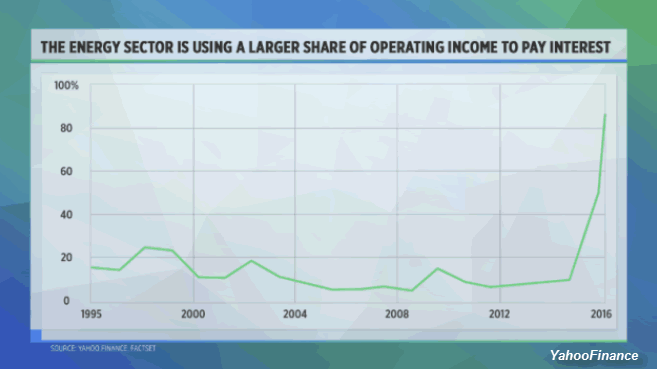
Since 2000, the U.S. Energy Sector was paying (on average) between 10-15% of its operating income to service its debt. However, that changed significantly in 2014 as the price of oil plunged. The reason this percentage jumped over 20% in 1998 was due to the price of oil falling below $15 compared to $22 in 1996.
So, why is the U.S. Energy Sector interest on the debt so much worse now with the price of oil more than double the 1998 price?? Again, the average annual price of oil in 1998 was $15 compared to $33 in Q1 2016. Why did the U.S. Oil and Gas Industry have to pay 86% of its operating income to service its debt during the first quarter of 2016 on the back of a $33 oil compared to 25% on $15 oil in 1998?
BECAUSE…. The U.S. Oil & Gas Industry has gone into massive debt to bring on very expensive energy supplies.
Here is one more chart from the energy article linked above:
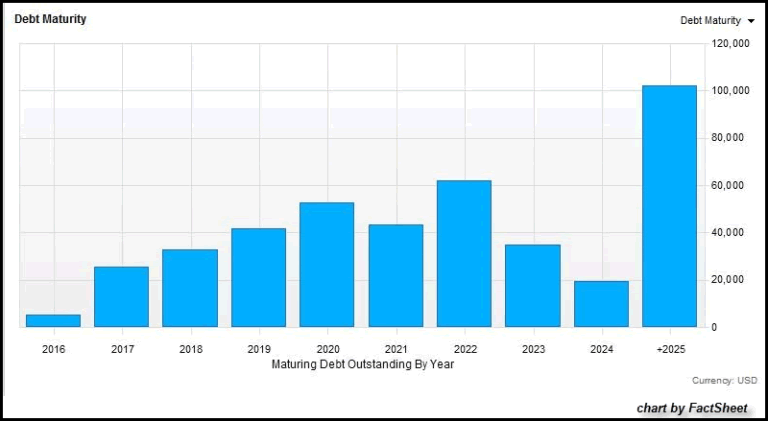
This chart shows the U.S. Energy Sector maturing debt outstanding for each year. According to the article:
While $5.1 billion of U.S. energy debt matures this year, $25.1 billion will mature in 2017. The number risies to $52.5 billion in 2020.
“There’s not a lot of this debt that comes due in 2016. But in 2017—that’s when the rubber will really hit the road. Now a lot of these companies are already looking to bankruptcy because people know that the bond position is untenable,” said Dicker.
As the article states, the outstanding U.S. energy debt that matures in 2017 ($25.1 billions) is five times what matures this year ($5.1 billion). How can the U.S. Energy Industry pay back this debt when it can barely pay the interest on its debt currently?
And… to make matters even worse, U.S. oil production is falling rapidly:
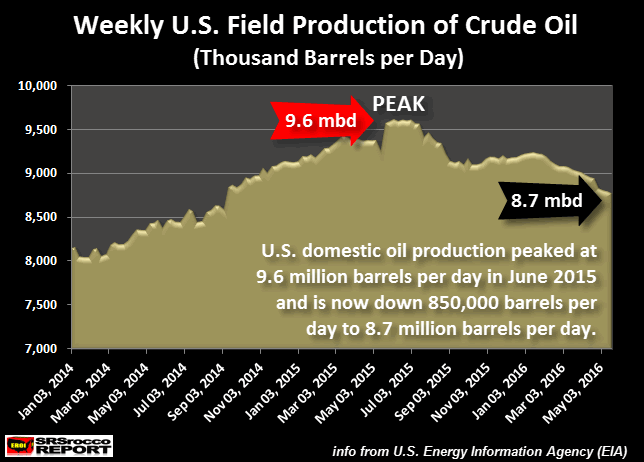
U.S. domestic oil production peaked at 9.6 million barrels per day (mbd) in June 2015 and is currently at 8.7 mbd. This is nearly a 10% decline in U.S. oil production in less than a year. Some may think this huge decline is due to lower oil prices. That may be partly true, however U.S. oil production was going to decline even with higher oil prices.
Which means, the U.S. Energy Sector will be in even more trouble as oil production declines further as the amount of debt that matures continues to increase over the next several years. This is extremely bad news for the U.S. economy as it will have to import more foreign oil to make up for declining domestic production.
Of course, this means the market will have to react by offering 96 and 108 month payment plans to keep the automobile financing bubble from popping. Furthermore, I would imagine the Plunge Protection Team will work overtime just to keep the markets from imploding.
As the fundamentals of the market continue to deteriorate, the precious metals offer the only real safe haven. As I mentioned in a previous article, Something Big Happened In The Gold Market, mainstream investors flocked into Gold ETF’s in record numbers during Q1 2016:
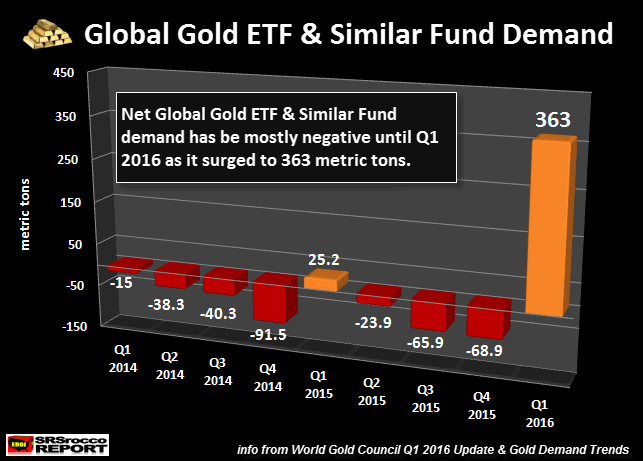
Investors moved into Gold ETF’s in a big way during the first quarter of 2016 on a mere 2,000 point drop of the Dow Jones. Why would investors move into Gold ETF in such a large degree as the market sustained a normal 15% correction?? Hell, in the first quarter of 2009, flows of gold into Gold ETF’s surged to a record 465 metric tons, but this was when the Dow Jones was crashing to its lows of 6,700.
I talk to several people in the industry, and the word out there is that mainstream investors are worried as hell about the markets. I believe when the broader markets really start their NEXT BIG CRASH, investors will flow into gold and silver in record volume.
This is not a matter of “IF”, but “WHEN.” However, if we go by the disintegration market fundamentals, that day will likely be sooner, rather than much later.
Lastly, if you haven’t checked out our new PRECIOUS METALS INVESTING page, I highly recommend you do.
Check back for new articles and updates at the SRSrocco Report. You can also follow us at Twitter, Facebook and Youtube.
![]()
2016 Copyright Steve St .Angelo - All Rights Reserved Disclaimer: The above is a matter of opinion provided for general information purposes only and is not intended as investment advice. Information and analysis above are derived from sources and utilising methods believed to be reliable, but we cannot accept responsibility for any losses you may incur as a result of this analysis. Individuals should consult with their personal financial advisors.
© 2005-2022 http://www.MarketOracle.co.uk - The Market Oracle is a FREE Daily Financial Markets Analysis & Forecasting online publication.