


Gold Projects Bullish Trend to $1215
Commodities / Gold & Silver Jul 19, 2008 - 01:49 PM GMTBy: Merv_Burak

 Gold has basically been on a roll for over a month, maybe it's time for a little rest. At this point it looks like no more than a rest but let's go through the routine.
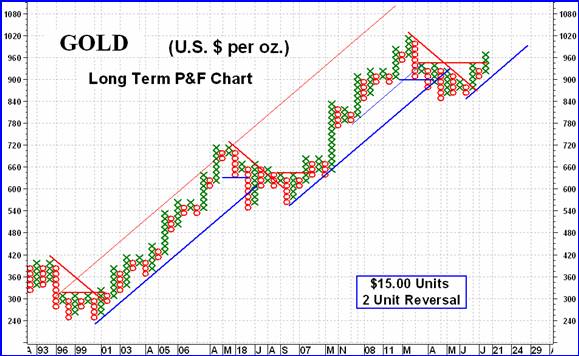
GOLD : LONG TERM - I've been away for a few weeks so this week is sort of a “catch-up” week. The long term P&F Chart shows an upside break-out with a projection to the $1215 level. That would put us into new all time high territory and could cause the price to continue towards that long held, very long term, projection to the $1600 mark.
Nothing in the news or charts suggests that the projections are way out of line. Of course, gold will not go straight up to those levels, there will be reversals along the way, but that's what it looks like from the P&F chart point of view.
From the normal charts and indicators things look good also. Using the daily chart indicators, gold is above its long term moving average line and the line slope is upwards. The long term momentum indicator remains in its positive zone, where it has been for years, and continues above its positive trigger line. The volume indicator is again at new all time highs and remains above its positive trigger line. From these indicators the only rating I can give the long term is a BULLISH rating.
INTERMEDIATE TERM
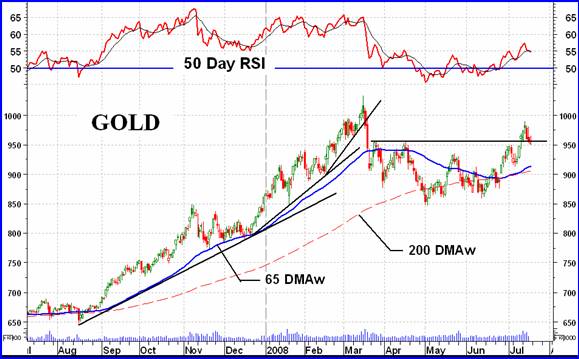
The picture on the intermediate term, although quite positive, is not as clear as the long term. We see the upside break-out through the resistance level but the break was not all that strong. There is a resistance in the $960 to $990 level from the early March action that seems to be causing the move some problem. Maybe a little rest will do it but that remains to be seen. The price of gold is above its positive moving average line and as long as it stays that way there is no real worry. The momentum indicator is confirming the price move but is not showing any extra strength behind the move.
A strong move should have seen the indicator at least above the 60% level. The indicator has dropped below its trigger line but the trigger is still pointing slightly upwards. The volume indicator is still the strongest indicator and is above its positive trigger line. Despite the slight weakness in the momentum indicator I must still rate the intermediate term as BULLISH . Maybe there will be a change next week but let's wait for it, it may not come.
SHORT TERM
Since turning up in mid-June, and especially since the very short term moving average line (8 DMAW) crossed to the up side, the short term moving average line (15 DMAW) has kept you positive, short term wise. Now, one might wonder if the short term upside move may be ending. It is starting to look iffy but all is not yet lost. Gold is sitting on top of its positive sloping moving average line and the momentum indicator is still in its positive zone. Momentum, however, is heading lower and is below its trigger line although the trigger is still slightly positive. The daily volume action has been improving on the up side and diminishing on the down side. Since reversing from its overbought zone a few days back gold has been moving lower but not at any desperation rate. For now the short term is still rated as BULLISH but that may change with a couple of more negative days.
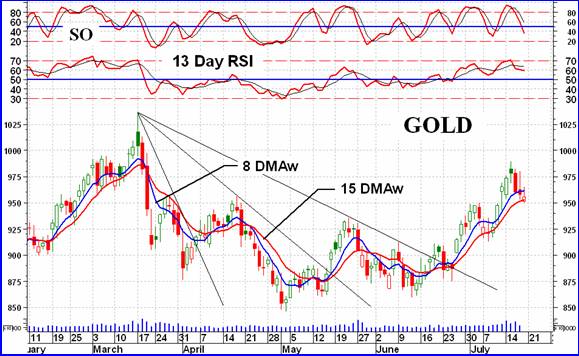
The immediate term direction of the action looks to be to the down side. Gold is already below its very short term moving average line although the line remains just slightly positive. The more aggressive Stochastic Oscillator (SO) is moving lower and is in its negative zone below its negative trigger line. The direction of motion is to the down side and that is the immediate term direction, until verified otherwise.
I am not an Elliott Wave person and confess not to understand the technique (although I did have to study it many, many years ago). It just looks like too much work for a lazy guy. However, for you Elliott Wave people out there, looking at the action since mid-June, have we completed a short term bull move and are into a bear phase? Or looking at the action since late April-early May, are we only at the second of the three up legs of a bull move? Youth wants to know. I much prefer my FAN Principle, when I have it. The Bullish Decelerating Fan confirmed a reversal in mid-June. I call it a Bullish Decelerating Fan because its completion and confirmation leads to a bull move and from Fan one to Fan two to Fan three the negative move is getting weaker and weaker (decelerating) from a common apex point.
SILVER
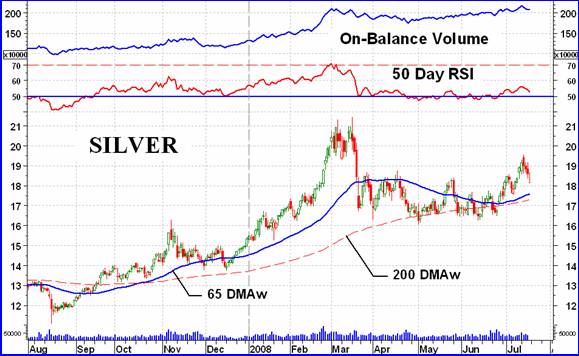
As the chart of silver shows, there is really very little difference between the recent action in silver and that of gold. The major difference, as I see it, is that the actions of the momentum and volume indicators are weaker here than for gold, even though gold momentum was not all that great. One can just read the gold review and apply it to silver for now.
Merv's Precious Metals Indices Table
Catching up will continue next week with a more detailed look at the stock Indices.
By Merv Burak, CMT
Hudson Aero/Systems Inc.
Technical Information Group
for Merv's Precious Metals Central
For DAILY Uranium stock commentary and WEEKLY Uranium market update check out my new Technically Uranium with Merv blog at http://techuranium.blogspot.com .
During the day Merv practices his engineering profession as a Consulting Aerospace Engineer. Once the sun goes down and night descends upon the earth Merv dons his other hat as a Chartered Market Technician ( CMT ) and tries to decipher what's going on in the securities markets. As an underground surveyor in the gold mines of Canada 's Northwest Territories in his youth, Merv has a soft spot for the gold industry and has developed several Gold Indices reflecting different aspects of the industry. As a basically lazy individual Merv's driving focus is to KEEP IT SIMPLE .
To find out more about Merv's various Gold Indices and component stocks, please visit http://preciousmetalscentral.com . There you will find samples of the Indices and their component stocks plus other publications of interest to gold investors.
Before you invest, Always check your market timing with a Qualified Professional Market Technician
Merv Burak Archive |
© 2005-2022 http://www.MarketOracle.co.uk - The Market Oracle is a FREE Daily Financial Markets Analysis & Forecasting online publication.