


Stock Market One Big Inflection Point We Will Look Back On
Stock-Markets / Stock Markets 2016 May 16, 2016 - 04:46 PM GMTBy: Chris_Vermeulen

 This week will very likely be one we look back on as a big inflection point. We will see that the bears are coming back.
It appears the market is forming a head and shoulders topping pattern. Thre are a couple different ways to trade this pattern depending on the level of skill and aggressiveness.
One can wait for a closing bar below the ‘neckline’ on the time-frame in which you have identified the pattern. By operating on a closing bar basis you significantly reduce the risk of entering on a ‘false’ breakout. Entering prior to the close of the bar increases the risk of becoming part of the wick of a reversal candlestick should it close back above ‘neckline’ support.
Another way is to try and time the right shoulder and short into the bounce or pause just before you think a neckline break is about to occur.
Both, have then pro’s and con’s, which is better, that all depends on the overall market conditions and that of the trader making the trade.
Take a look a couple charts below so you can see where I feel the stock market is within this pattern.
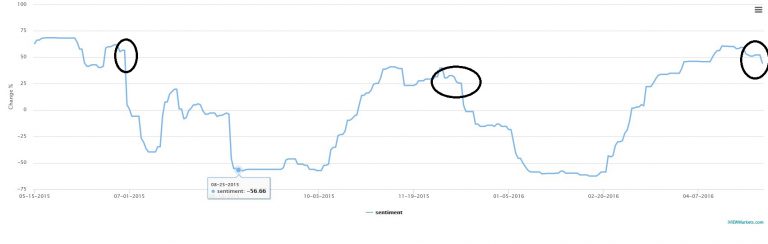
iViewMarkts.com Bullish Sentiment Indicator: This shows active traders have been very bullish and are just now starting to become bearish. As more short term traders start to sell their long positions and build up short positions this will put downward pressure on stocks and likely start the new trend down.
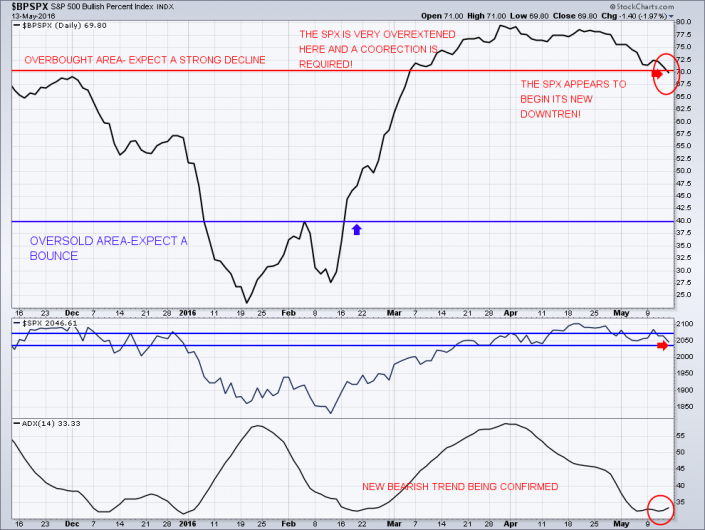
SP500 Bullish Percent Index: This chart is telling us more stocks are starting to form bearish price patterns after being overbought the last couple months.
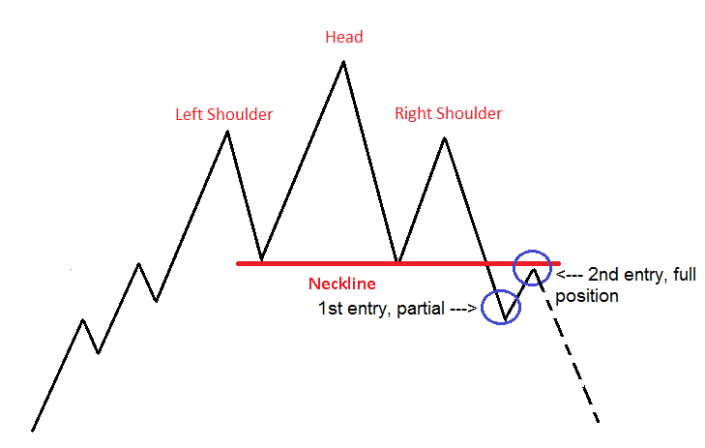
Head & Shoulders Pattern: This is the pattern I speak of showing where most traders enter positions for this price pattern. There is always a possibility that the market does not do a Kiss goodbye (retest of breakdown). The strongest moves to the downside will not retest the breakdown in most cases so playing the breakdown I think is vital.
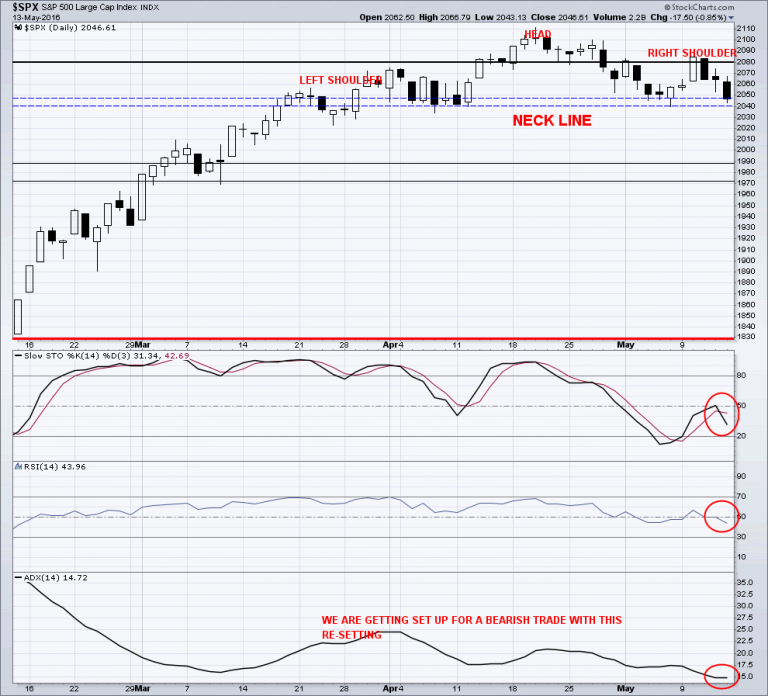
SP500 Head & Shoulders Pattern:
That is a quick snapshot of the market and where it stands…
Get My Trade Alerts In Real-Time: www.TheGoldAndOilGuy.com
Chris Vermeulen
Join my email list FREE and get my next article which I will show you about a major opportunity in bonds and a rate spike – www.GoldAndOilGuy.com
Chris Vermeulen is Founder of the popular trading site TheGoldAndOilGuy.com. There he shares his highly successful, low-risk trading method. For 7 years Chris has been a leader in teaching others to skillfully trade in gold, oil, and silver in both bull and bear markets. Subscribers to his service depend on Chris' uniquely consistent investment opportunities that carry exceptionally low risk and high return.
Disclaimer: Nothing in this report should be construed as a solicitation to buy or sell any securities mentioned. Technical Traders Ltd., its owners and the author of this report are not registered broker-dealers or financial advisors. Before investing in any securities, you should consult with your financial advisor and a registered broker-dealer. Never make an investment based solely on what you read in an online or printed report, including this report, especially if the investment involves a small, thinly-traded company that isn’t well known. Technical Traders Ltd. and the author of this report has been paid by Cardiff Energy Corp. In addition, the author owns shares of Cardiff Energy Corp. and would also benefit from volume and price appreciation of its stock. The information provided here within should not be construed as a financial analysis but rather as an advertisement. The author’s views and opinions regarding the companies featured in reports are his own views and are based on information that he has researched independently and has received, which the author assumes to be reliable. Technical Traders Ltd. and the author of this report do not guarantee the accuracy, completeness, or usefulness of any content of this report, nor its fitness for any particular purpose. Lastly, the author does not guarantee that any of the companies mentioned in the reports will perform as expected, and any comparisons made to other companies may not be valid or come into effect.
Chris Vermeulen Archive |
© 2005-2022 http://www.MarketOracle.co.uk - The Market Oracle is a FREE Daily Financial Markets Analysis & Forecasting online publication.