


How Strong is The U.S. Economy Really?
Economics / US Economy May 11, 2016 - 04:05 AM GMTBy: Clif_Droke

 In the six years since the recovery began, there has been endless debate over the strength of the U.S. economy. There are basically two sides of the debate. Those taking the positive side maintain the economy has almost returned to its pre-crisis levels and is on a firm footing. The opposing camp maintains that while the upper classes are in fine shape, the middle class is still hurting from the residual damage inflicted by the housing bubble implosion and credit crash. Is one side entirely mistaken or is there truth to both assertions?
And what about the U.S. retail picture? The following graph shows our New Economy Index (NEI), which is a real-time measure of the overall strength or weakness in the U.S. retail economy. As the chart shows, NEI is testing its previous all-time high and may well make a token new high by the end of this week. The index is reflecting strong retail sales from online firms like Amazon, as well as healthy shipping volumes from Fed-Ex. The NEI is telling us that the overall U.S. retail sales climate is quite firm as we head closer to summer.
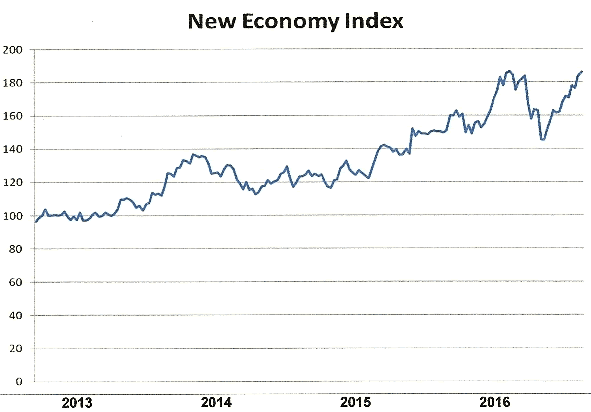
Although many business owners remain worried over growth prospects, mainly because of overseas woes, consumers don't seem to share this concern. They just keep spending as the NEI chart suggests. Even discretionary consumer stock components in the NEI like Starbucks Corp. (SBUX) are seeing healthy demand, a sign that the retail economy is anything but weak.
Is it possible, however, that the bulk of retail spending is being done by upper middle and upper class shoppers without widespread participation among the "middle" middle class? Neal Gabler, writing in the May issue of Atlantic magazine, made the startling discovery that fully 47 percent of Americans would have a hard time coming up with $400 for an emergency expense and would have to borrow or sell something to raise the cash.
Commenting on this trend, Carolyn O'Hara of The Week wrote: "Opportunities are eroding, and nearly all the wealth created in recent years has gone to the top 10 percent of wage earners; a middle-income American family actually makes 7 percent less, in inflation-adjusted terms, than it did 15 years ago."
Indeed, for many Americans the recovery has hardly been felt. Although the unemployment rate is now 5 percent with jobless claims at their lowest level since 1973, those numbers are misleading according to Sarah Kendzior. Writing in Qz.com, Kendzior stated that those numbers hide a "devastating story of underemployment, wage loss, and precariousness that defines life for millions of Americans."
Since 2008, for instance, the labor participation rate has fallen from a high of 67.3 percent in 2000 to 62.6 percent today, which is a 38-year low. "The jobless number is low because millions of people have given up looking for work, even though they might still very much like a job," Kendzior said.
Kendzior also pointed out the growing number of workers involved in the "1099 economy," which involves freelance and contract workers. The share of such workers has grown from 10.1 percent in 2005 to 15.8 percent in 2015. These workers are counted as "employed" by government statisticians despite the tenuous, often temporary nature of their work. Moreover, 44 percent of the new jobs created between 2008 and 2012 were in the low-paid service sector.
On a related note, direct participation in the stock market by the middle class is on the wane. Only 52 percent of Americans now say they own stock, according to a Gallup poll, matching a record low set in 2013. Stock ownership peaked just prior to the onset of the 2008 financial crisis, when nearly two-thirds of Americans were invested in equities.
Clearly, then, the fortunes of the U.S. middle class have been drastically reduced. The surging popularity of Donald Trump as a presidential candidate is certainly a huge cultural indicator of the level of discontent within the middle class. Whether the decline is terminal is a matter for debate. There are some factors, however, which if realized could serve as a temporary palliative for the middle class malaise.
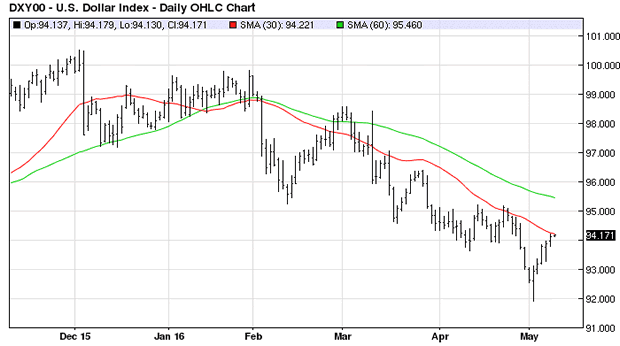
One such factor would be a significant weakening of the U.S. dollar. Dollar weakness isn't something that most middle class consumers look forward to, especially since it entails higher prices for food and fuel. But the dollar strength of the last couple of years has actually held back the economy from growing at a more rapid pace. A stronger dollar encourages cash hoarding and is a symptom of global deflation, which in its turn engenders fear among investors. This has kept the trillions in QE money from flowing out of savings and into the economy where it is needed. In other words, it has helped to suppress the velocity of money.
A weaker dollar would also kick start the global economy again by allowing commodity-dependent countries to rebound, which in turn would help the U.S. economy recover. Most importantly, it would remove the single biggest fear which has held back commitments from global investors, namely China's slowdown. A weaker dollar would almost certainly help China recover and remove the obstacle which has caused more trouble for the U.S. stock market and economy in the last year.
Additional dollar weakness would also help stimulate the commencement of a new inflationary cycle after several years of near-deflation. Normally this would be something to be avoided, but given the global undercurrent of deflation a healthy dose of inflation would be most welcome. Most importantly, it would serve to loosen up the massive amounts of sidelined cash and could give the middle class a desperately needed break, if only a temporary one.
Global warming: Where's Waldo?
According to The New York Times, 2016 is already on track to a "record-breaking start for shattering global temperatures." The Times said this year has already been "the hottest year to date" with January, February and March higher than the year-ago temperatures. It was widely trumpeted that each of the two previous years were also "hottest years on record," according to data kept by NOAA and NASA.
The old saying, "Follow the money trail," definitely applies to the climate change agenda due to governments' attempts to impose taxes and restrictions on businesses that allegedly contribute to it. Global warming theory is more than just a scientific curiosity; it's an economic issue of monolithic proportions. It has also attracted its fair share of data fabrication and outright lies.
Listening to climatologists, one would think that temperatures everywhere are unbearably hot, particularly in southern climates. For most of us living in the U.S. and other Western Hemisphere countries, however, everyday experience doesn't always bear this out.
When it comes to the phenomenon known as global warming, a cursory examination of the daily temperature record (which hasn't been massaged by politically-biased researchers) leads us to ask the following question: "Where's Waldo?"
The reference of course is to the well-known children's book character made famous for his uncanny ability to conceal his presence in any situation. The reader is exhorted to find Waldo hiding somewhere in the crowd. The same task could easily be asked of individuals seeking the truth about supposedly rising global temperatures and its consequences. Where exactly is the everyday proof that temperatures are universally rising?
For the better part of the last decade I've recorded daytime high temperatures at my residence in coastal North Carolina. Here's what the trend actually looks like. FYI, it was generated in Excel as a simple daily line graph.
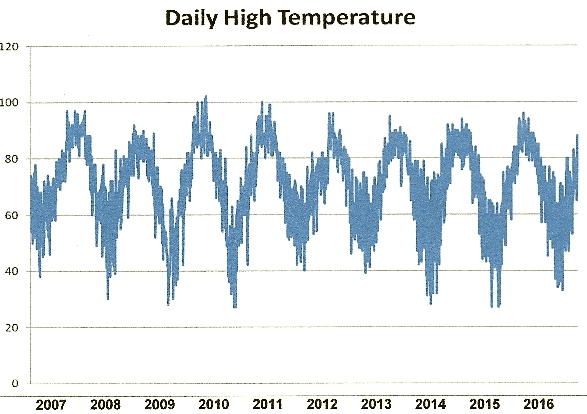
Again I would ask, where's Waldo? Clearly there is no discernible temperature trend in my corner of the Southeastern U.S. The yearly fluctuation of temperatures adheres to a fairly predictable seasonal cyclicality. At no point in the last nine years has there been a significant deviation from the annual-mean. The data in the above graph from the last three years also contradicts the assertion that "global temperatures" (however that is defined) hit record highs in each of those years.
It stands to reason, moreover, that what is true for Topsail Island, NC is also likely true for a large section of the Southeastern U.S. Atlantic coastal region. If we're not experiencing rising temperatures there undoubtedly are other parts of the country that aren't, either. It further begs the question as to how exactly "global temperatures" are calculated by the climatologists who insist upon the veracity of the global warming theory.
When I first learned of the global warming theory in 1987, we were told by climatologists that within 20 years temperatures would universally be rising and likely on a yearly basis - so much so that we would all feel it. They were very wrong. The above temperature graph amply demonstrates that in a 10-year period there has been no rising trend in at least one portion of the globe. If rising temperatures aren't truly universal, then "global warming" is a misnomer.
Mastering Moving Averages
The moving average is one of the most versatile of all trading tools and should be a part of every investor's arsenal. Far more than a simple trend line, it's also a dynamic momentum indicator as well as a means of identifying support and resistance across variable time frames. It can also be used in place of an overbought/oversold oscillator when used in relationship to the price of the stock or ETF you're trading in.
In my latest book, Mastering Moving Averages, I remove the mystique behind stock and ETF trading and reveal a simple and reliable system that allows retail traders to profit from both up and down moves in the market. The trading techniques discussed in the book have been carefully calibrated to match today's fast-moving and sometimes volatile market environment. If you're interested in moving average trading techniques, you'll want to read this book.
Order today and receive an autographed copy along with a copy of the book, The Best Strategies for Momentum Traders. Your order also includes a FREE 1-month trial subscription to the Momentum Strategies Report newsletter: http://www.clifdroke.com/books/masteringma.html
By Clif Droke
www.clifdroke.com
Clif Droke is the editor of the daily Gold & Silver Stock Report. Published daily since 2002, the report provides forecasts and analysis of the leading gold, silver, uranium and energy stocks from a short-term technical standpoint. He is also the author of numerous books, including 'How to Read Chart Patterns for Greater Profits.' For more information visit www.clifdroke.com
Clif Droke Archive |
© 2005-2022 http://www.MarketOracle.co.uk - The Market Oracle is a FREE Daily Financial Markets Analysis & Forecasting online publication.