


SPX Downtrend Probably Underway
Stock-Markets / Stock Markets 2016 May 08, 2016 - 03:31 PM GMTBy: Tony_Caldaro

 The week started out at SPX 2065. After a higher open and rally to SPX 2083 on Monday the market sold off for the rest of the week. Aided by two gap down openings the market hit SPX 2039 on Friday. Then it rallied to end the week at SPX 2057. For the week the SPX/DOW lost 0.30%, and the NDX/NAZ lost 0.55%. Economic reports for the week were mixed. On the downtick: ISM manufacturing, the ADP, monthly Payrolls, Q2 GDP est., and weekly jobless claims increased. On the uptick: construction spending, factory orders, ISM services, consumer credit, long term investor sentiment, and the trade deficit narrowed. Next week’s reports will be highlighted by the PPI, Retail sales, and Business/Wholesale inventories.
LONG TERM: bear market
We continue to label all the activity from late 2015 as the early stages of a new bear market. The five Primary waves expected to complete the Cycle [1] bull market ended in 2015. Primary waves I and II concluded in 2011, and Primary waves III, IV and V concluded in 2015. The first downtrend of the bear market bottomed in mid-February 2016 after a 15% decline. The first uptrend of the bear market appears to have ended at SPX 2111 in mid-April. We have labeled the first downtrend as Major wave A, and the recent uptrend as Major wave B. Major wave C of Primary A should now be underway.
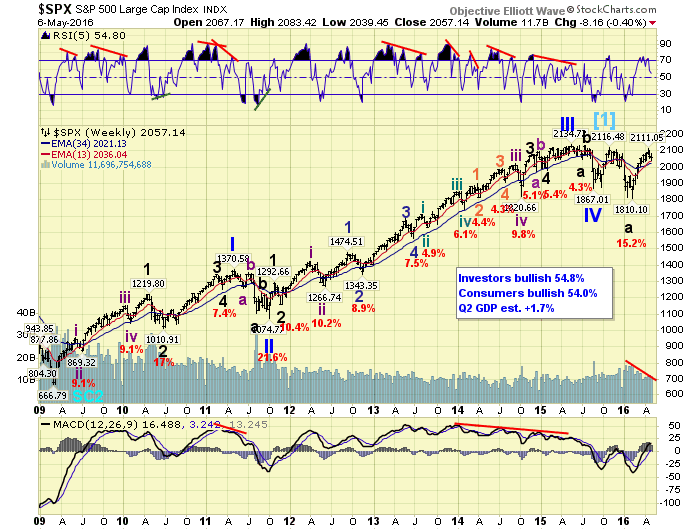
Last weekend we presented the daily/weekly charts of the NDX. We believe this index is more indicative of the actual state of the stock market, since it does not have any energy/commodity stocks. Both of which have rebounded strongly with the decline in the USD, and expectations of a manufacturing rebound in China. Thus far the China rebound has yet to materialize, as manufacturing PMI was reported this week lower at 50.1. The NDX made a lower low this week for its confirmed downtrend. Then rebounded on Friday to lose only 0.3% on the week. The NAZ also confirmed a downtrend.
MEDIUM TERM: downtrend probable
This week we posted a tentative green Major wave B label at SPX 2111. The SPX, and the DOW for that matter, have yet to confirm their downtrends. For the two month uptrend, Mid-February to mid-April, we counted 11 significant waves, which is a corrective pattern. These eleven waves all unfolded within a three Intermediate wave ABC structure. Five overlapping waves for Int. A and five overlapping waves for Int. C.
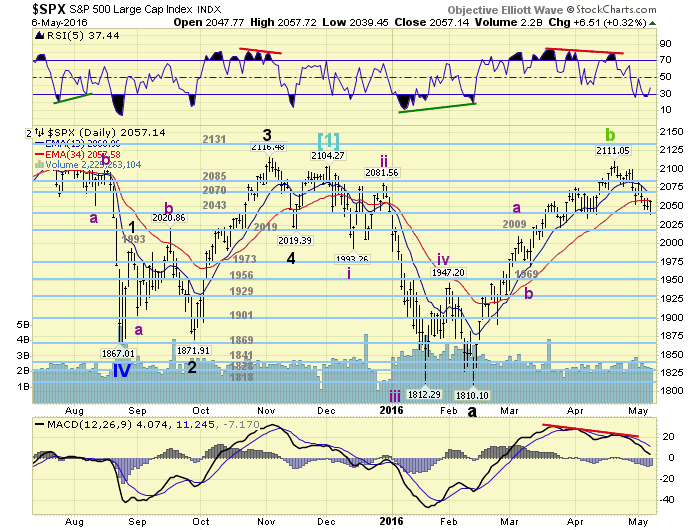
The negative RSI/MACD divergences that appeared on the NDX/NAZ charts before they declined to confirm downtrends also appear on the SPX/DOW charts. As noted above. After the SPX 2111 uptrend high the market has declined for 2+ weeks, has had its biggest decline since the uptrend began, and the RSI hit oversold for the first time since the last correction. Certainly enough negatives to suggest lower prices are yet ahead. Medium term support is at the 2043 and 2019 pivots, with resistance a the 2070 and 2085 pivots.
SHORT TERM
Since Major wave A declined in five Intermediate waves, even though each of the three declining waves actually looked corrective internally. We expected Major wave C would start off looking impulsive. It has not. This first decline, probably Int. i also looks corrective internally. Odd looking patterns, but not all that unusual for a bear market.
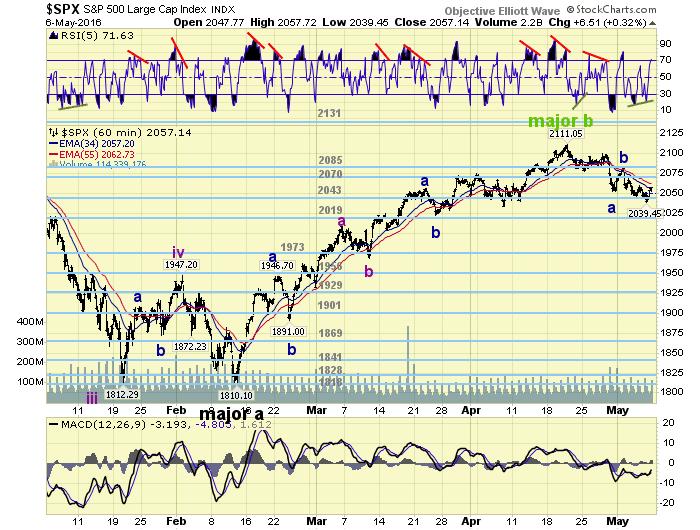
During the 100+ point decline of Int. i/Major A we counted seven overlapping internal waves. Thus far, during this decline, we have counted six overlapping waves: 2079-2099-2052-2083-2039-2058? This suggests the market should experience one more decline, probably to the 2019 pivot range, before a substantial Int. ii rally gets underway. Short term support is at the 2043 and 2019 pivots, with resistance at the 2070 and 2085 pivots. Short term momentum rose to overbought on Friday after a positive divergence. Trade what’s in front of you!
FOREIGN MARKETS
Asian markets were mostly lower on the week for a 1.9% loss.
European markets were also mostly lower for a 1.9% loss.
The Commodity Equity markets were all lower for a 3.4% loss.
The DJ World index lost 2.0% on the week.
COMMODITIES
Bonds continue to uptrend and gained 0.50% on the week.
Crude is still uptrending but lost 3.1% on the week.
Gold is still uptrending too and lost 0.1% on the week.
The USD is trying to uptrend and gained 0.9% on the week.
NEXT WEEK
Tuesday: Wholesale inventories. Wednesday: the Treasury deficit. Thursday: weekly Jobless claims, and Import/Export prices. Friday: the PPI, Retail sales and Consumer sentiment. Best to your weekend and week!
CHARTS: http://stockcharts.com/public/1269446/tenpp
After about 40 years of investing in the markets one learns that the markets are constantly changing, not only in price, but in what drives the markets. In the 1960s, the Nifty Fifty were the leaders of the stock market. In the 1970s, stock selection using Technical Analysis was important, as the market stayed with a trading range for the entire decade. In the 1980s, the market finally broke out of it doldrums, as the DOW broke through 1100 in 1982, and launched the greatest bull market on record.
Sharing is an important aspect of a life. Over 100 people have joined our group, from all walks of life, covering twenty three countries across the globe. It's been the most fun I have ever had in the market. Sharing uncommon knowledge, with investors. In hope of aiding them in finding their financial independence.
Copyright © 2016 Tony Caldaro - All Rights Reserved Disclaimer: The above is a matter of opinion provided for general information purposes only and is not intended as investment advice. Information and analysis above are derived from sources and utilising methods believed to be reliable, but we cannot accept responsibility for any losses you may incur as a result of this analysis. Individuals should consult with their personal financial advisors.
Tony Caldaro Archive |
© 2005-2022 http://www.MarketOracle.co.uk - The Market Oracle is a FREE Daily Financial Markets Analysis & Forecasting online publication.