


CRB, Gold, Oil, Cotton, Coffee - 7 Must See Commodities Charts
Commodities / Commodities Trading Apr 26, 2016 - 04:43 AM GMTBy: InvestingHaven

 Commodities are in a positive cycle. It is too early to tell whether the long term bear market is over, but short and medium term momentum is clearly in favor of commodity bulls.
In this article, we revise 7 must-see charts covering the commodities complex, which reveal current and future investment opportunities.
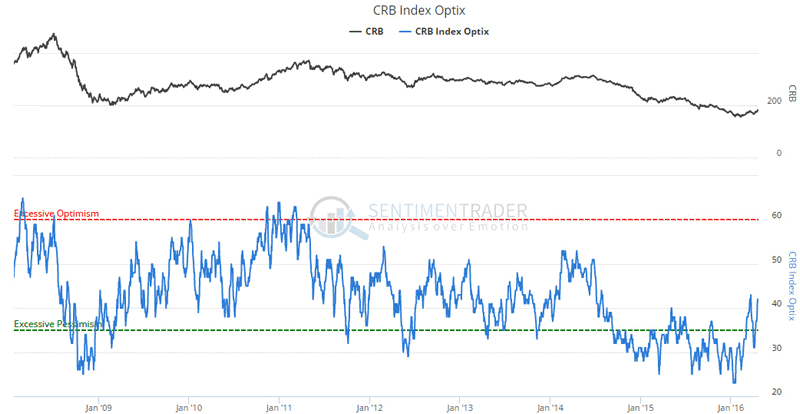
First, the CRB commodoties index bottomed in January of this year. At that point in time, sentiment was even worse than during the depth of the 2008 financial crisis. The first chart shows how bad sentiment was in the last months of 2015 / early January 2016, see lower pane. Consequently, the upside potential is enormous as commodities are currently nowhere near positive sentiment levels.
Chart courtesy: Sentimentrader.
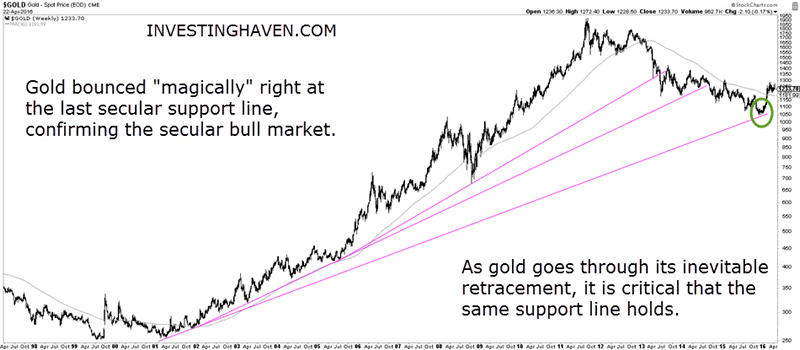
Gold, being one of the leading commodities, has shown great strength in 2016. Uncoincidentally, gold has bounced right at secular support in January of this year. This is another proof that secular trend lines are extemely powerful. Note how this trend line was the last of three secular trend lines. As gold will retrace in the near future, it is imperative that the trend line is not broken to the downside, which would be the ultimate confirmation that the secular bull market is intact.
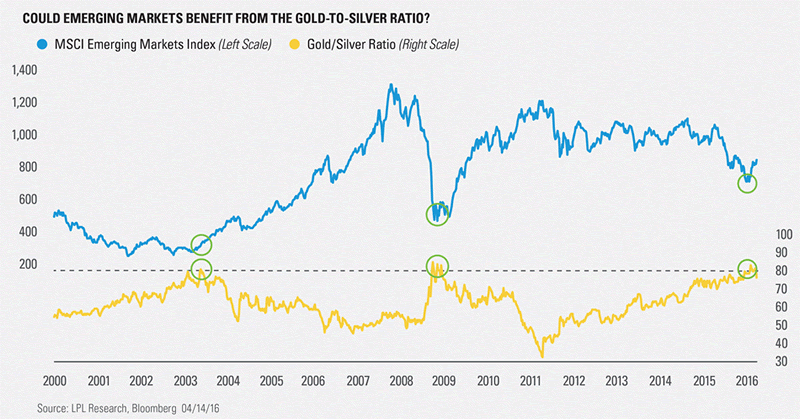
It took some time, but silver started to rally recently, several weeks after gold’s rally. That is probably because silver was reacting with the rally in most other base metals. Because of that, the gold to silver ratio (yellow line on below chart) has come down after hitting +80, an area that has coincided with a major top in that ratio in the last decades. According to LPL Research, there is a correlation between such a major gold to silver ratio top, and emerging markets.
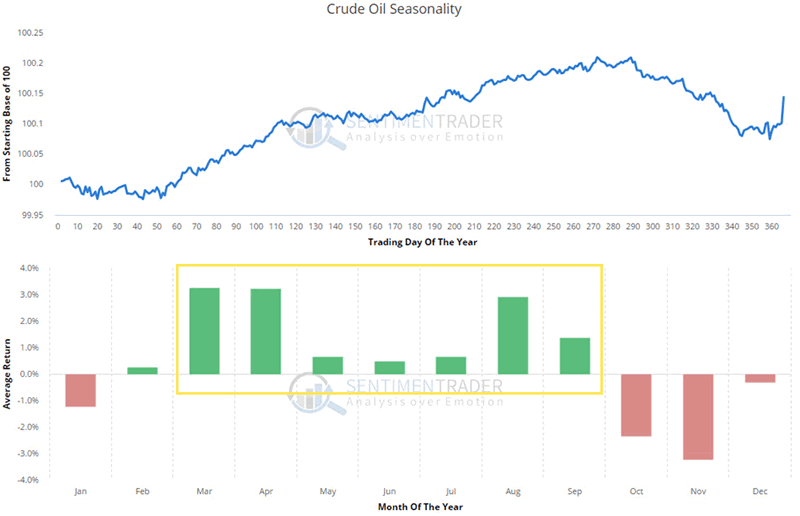
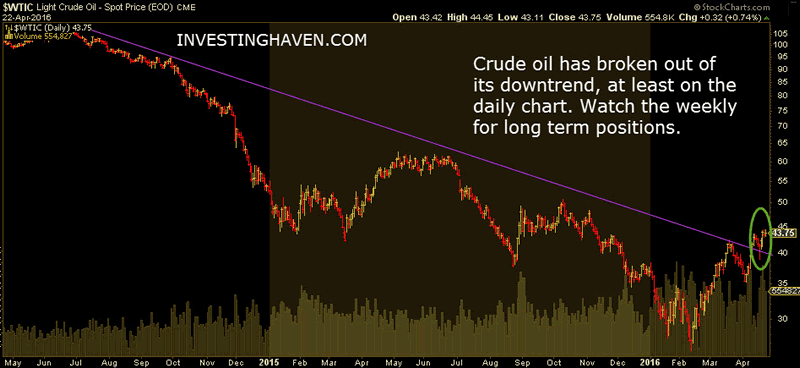
Crude oil, another leading commodity, is performing extremely well since early February. Chances are high that $27 /barrel was the absolute bottom. Not only have we shown that all our indicators were suggesting an end to the collapse, but also seasonality is favoring higher prices, making a stronger case for an absolute bottom back in February. As the next chart shows, based on seasonality, crude oil is set to continue its positive cycle until September. Chart courtesy: Sentimentrader.
Not only has crude oil performed extremely well, it has even broken out recently. The purple trend line on the next chart goes back two years, and represents the collapse. As crude is climbing higher, it has taken out that important trend line. Expect higher prices in the short and medium term, unless the breakout would be invalidated in the very short term.
In closing, we are looking at two commodities which are not leading, but they provide appealing chart structures.
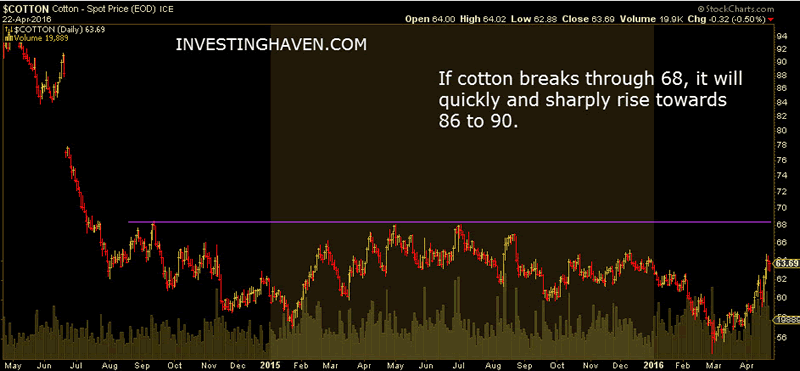
First, cottton is in a bottoming formation. The beauty of a bottom is that (a) it becomes easy to identify a breakout and (b) breakouts tend to be violent. In general, the rule of thumb is that the longer the bottom the higher the upside. Now we are not making any statement on the timing of a breakout, but we can only pinpoint the breakout level: as soon as cotton breaks through $68, we will see a quick and sharp rise to the 86 / 90 level.
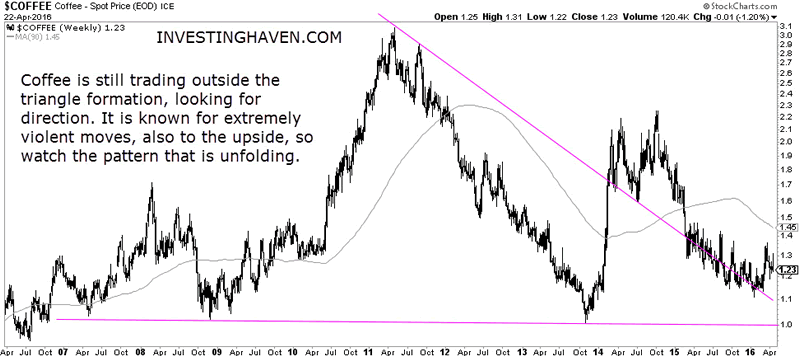
The second commodity with an interesting chart setup is coffee. There is a secular chart pattern as represented by the purple lines on below chart. Interestingly, with the rally of 2014, coffee broke out of that pattern, and traded outside of it since then. It is not very clear in which direction coffee is going, and what type of pattern is unfolding. What we do know, however, is that coffee has a tendency to move aggressively, so you better follow coffee closely.
Investment opportunities in the commodities complex will be discussed at length during the next webinar, on Wednesday April 27th. Register now, it’s free. You can ask your question in advance (even in case you can’t make it, you are at least sure that your question will be handled, and you can consult the answer afterwards).
SPECIAL: Next live webcast on Wed April 27th: investing in commodities (subscribe for free) >>Analyst Team
The team has +15 years of experience in global markets. Their methodology is unique and effective, yet easy to understand; it is based on chart analysis combined with intermarket / fundamental / sentiment analysis. The work of the team appeared on major financial outlets like FinancialSense, SeekingAlpha, MarketWatch, ...
Copyright © 2016 Investing Haven - All Rights Reserved Disclaimer: The above is a matter of opinion provided for general information purposes only and is not intended as investment advice. Information and analysis above are derived from sources and utilising methods believed to be reliable, but we cannot accept responsibility for any losses you may incur as a result of this analysis. Individuals should consult with their personal financial advisors.
© 2005-2022 http://www.MarketOracle.co.uk - The Market Oracle is a FREE Daily Financial Markets Analysis & Forecasting online publication.