


US Dollar Price Forecast
Currencies / US Dollar Apr 24, 2016 - 06:20 PM GMTBy: Austin_Galt

 Is the US Dollar in a new bull market or is it about to crash? Opinions seem divided on this issue and mine is a mixture of both depending which time frame is used.
Let's begin the analysis with the short term outlook followed by some big picture analysis.
US Dollar Index Daily Chart

The 3rd December 2015 high at 100.60 was pinpointed exactly in previous analysis produced the day before on the 2nd December 2015. This analysis outlined the expectation for a top and subsequent multi-month move down. I believe the first leg down is now complete and a bear rally is now in play.
How high do I expect this bear rally to trade?
The first rallies in new bear trends often make deep retracements as the bears mettle is fully tested. I have added Fibonacci retracement levels of the move down from December 2015 high to recent low and I am targeting price to get back to the 76.4% level at the minimum. This level stands at 98.95. The 88.6% level at 99.80 should also not be dismissed.
The horizontal line denotes the January 2016 high of 99.95 which should offer solid resistance and I expect price to turn back down below this level. Price turning down just below this level would create a bearish double top with the trend and that setup would look very appealing to the bears.
I have drawn a Fibonacci Fan from the December 2015 high to recent low and I am targeting this bear rally to top out around the 88.6% angle as so many first bear rallies do.
I believe a 5 point broadening low is currently in progress with points 1 to 3 already in place. This bear rally will end with a point 4 high. It is possible for a lower high only to form below the point 2 high but that would be too easy. Price trading above the point 2 high of 98.59 will fool the crowd into thinking a new bull trend is in force and that is what the majority will need to believe before the next leg down commences. Also, moves into point 4 highs are often impulsive which is another market deception aimed at putting people on the wrong side. Once the point 4 high is in place then the downtrend should resume and eventually end with a point 5 low.
The Bollinger Bands show price bouncing up and down between the upper and lower bands which is consistent with trend changes. I favour one last pullback back to at least the middle band before this bear rally really gets going.
The RSI and MACD indicators both show multiple bullish divergences at this point 3 low and that adds confidence that a significant move higher is set to occur.
So, the short term outlook appears bullish with clear target levels for the move up to terminate. That is, above 98.59 and below 99.95 with a bias closer to the latter number.
Let's now go to the monthly chart to try and determine where the downtrend is likely to bottom out.
US Dollar Index Monthly Chart

The more I look at this chart the more bearish I become. When trying to forecast areas for where a trend may end, it is useful to think what is the absolute limit price can trade without breaking the overall technical picture. In this case, the expectation is for a higher low which would need to be above the March 2008 low of 70.80.
The lower horizontal line denotes the May 2011 low at 72.86 and I view that as a solid low that price will not surpass.
The three closely bunched horizontal lines denote previous swing lows set during the late 2012 to late 2013 period. My gut instinct tells me price needs to take out these levels as doing so would get the crowd turning bearish again and help price make one final whoosh into a major low.
So, where exactly do I favour the higher low to form?
I have added Fibonacci retracement levels of the move up from March 2008 high to December 2015 high. I believe that was the first major leg of big bull market and as such I now expect a deep correction. Hence, I am favouring the 76.4% level at 77.83 while the 88.6% level at 74.20 also has some potential. I personally favour closer to the latter level.
Originally, I was favouring the 61.8% level at 82.18 and while price may bounce off that level I now favour any move higher from there will be temporary only.
I have drawn a Fibonacci Fan from the March 2008 low to December 2015 high which shows price currently finding support at the 23.6% angle so a bounce up from here could be expected. I am targeting the 88.6% angle eventually to see in the higher low. This angle looks set to be just above the 88.6% Fibonacci retracement level during the middle of 2017 so that is some timing to watch for the higher low.
The Bollinger Bands show price recently bouncing off the lower band and I favour price trading back above the middle band before the downtrend really takes hold. This is in line with the daily chart analysis.
The RSI is currently looking weak and providing excellent conditions for the downtrend to get going shortly. Interestingly, this indicator showed a new high back in 2015 which is generally bullish for the longer term view. By that I mean once the higher low is in place then price should trade back up to new price highs while this indicator makes lower highs - bearish divergences. This will obviously take many, many months to untold.
The MACD indicator also showed a bearish divergence at the recent high and is now bearish.
So, we now have short term high and medium term low targets. What is price likely to do over the longer term once the expected higher low is in place? Let's go to the quarterly chart to try and answer that question.
US Dollar Index Quarterly Chart
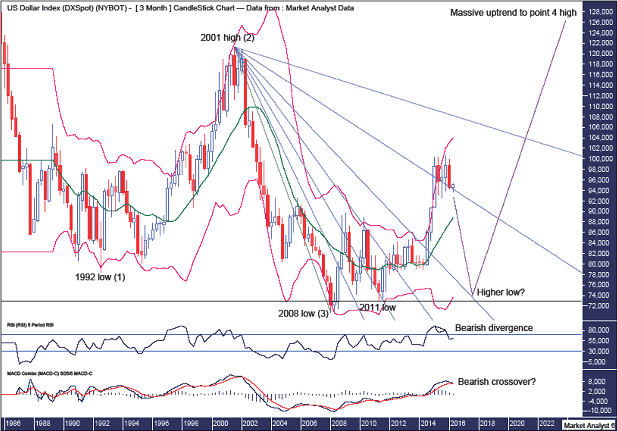
The RSI shows a little bearish divergence at the recent high while the MACD indicator looks set to make a bearish crossover imminently.
The Bollinger Bands show price starting to leave the upper band and I expect the higher low to be back down around the lower band.
I have drawn a Fibonacci Fan from the 2001 high to 2008 low which shows some nice price symmetry. Price has recently traded marginally above the 76.4% angle but the support is look shaky and I favour a move back down to test support from the 61.8% angle and it is there where I favour the higher low to form. Once that higher low is in place then price should explode higher eventually taking out the 88.6% angle.
Previously, my long term outlook called for a lower high below the 2001 high of 121.29. While this is certainly a possibility, my favoured scenario is that a massive 5 point broadening low is in play. This assumes the 1992 low is point 1, the 2001 high is point 2 and the 2008 low is point 3. That means price is currently tracing out its way to a point 4 high. This point 4 high will mark the end of the bull market that began in 2008.
So, where is this point 4 high likely to be?
Unfortunately, my trading software only has data going back to November 1985 which doesn't include the all time high set in February 1985 at 164.72. However, we can still calculate the Fibonacci retracement levels of the move down from that all time high to the 2008 low at 70.80. Let's run through the key levels.
Keep in mind, for this pattern to play out the high needs to be above the point 2 high at 121.29. The 61.8% level stands at 128.84. I favour a more substantial break above the point 2 high so once again I will be targeting the 76.4% level which stands at 142.55. The 88.6% level stands at 154.01 but that just seems too high. Nope, we'll settle for a final bull market high around 142 in the years to come.
Once that point 4 high is in place then a massive crash to a point 5 low will finally occur. That is the crash all the bears will have waited a decade for!
I expect the point 4 bull market high will coincide with the US Dollar losing its reserve currency status. The end of an empire...
By Austin Galt
Austin Galt is The Voodoo Analyst. I have studied charts for over 20 years and am currently a private trader. Several years ago I worked as a licensed advisor with a well known Australian stock broker. While there was an abundance of fundamental analysts, there seemed to be a dearth of technical analysts. My aim here is to provide my view of technical analysis that is both intriguing and misunderstood by many. I like to refer to it as the black magic of stock market analysis.
Email - info@thevoodooanalyst.com
© 2016 Copyright The Voodoo Analyst - All Rights Reserved
Disclaimer: The above is a matter of opinion provided for general information purposes only and is not intended as investment advice. Information and analysis above are derived from sources and utilising methods believed to be reliable, but we cannot accept responsibility for any losses you may incur as a result of this analysis. Individuals should consult with their personal financial advisors.
Austin Galt Archive |
© 2005-2022 http://www.MarketOracle.co.uk - The Market Oracle is a FREE Daily Financial Markets Analysis & Forecasting online publication.